Performance Lab
Turning a day of clinical diagnostics into something you can actually read.
The Ultrahuman Performance Lab puts more than a dozen diagnostic stations into a single visit, from a DEXA scan and a CPET to an ECG, an eye scan, a hearing test, gut sequencing and a genomic panel, and it comes back with around five hundred biomarkers. I designed the dashboard all of that lands in, which sits inside Ultrahuman Vision: a performance score with a grade for every category, a detail page behind each station, and an Action Plan you can take away as a report.
Product Design: Nachiket Palkar
The body, not a list
The dashboard opens on an interactive 3D figure instead of a list of stations. A list would have worked, and it would have made the body incidental to its own report. Markers sit on the anatomy they belong to, so nothing needs a label to say which part it covers, and each marker carries its status as colour, which lets the whole body be read before anything is opened. The figure is also the way in: tapping a marker lands you on that station, so it is the index rather than a picture of one. That difference is what keeps a 3D object on a clinical dashboard from being decoration.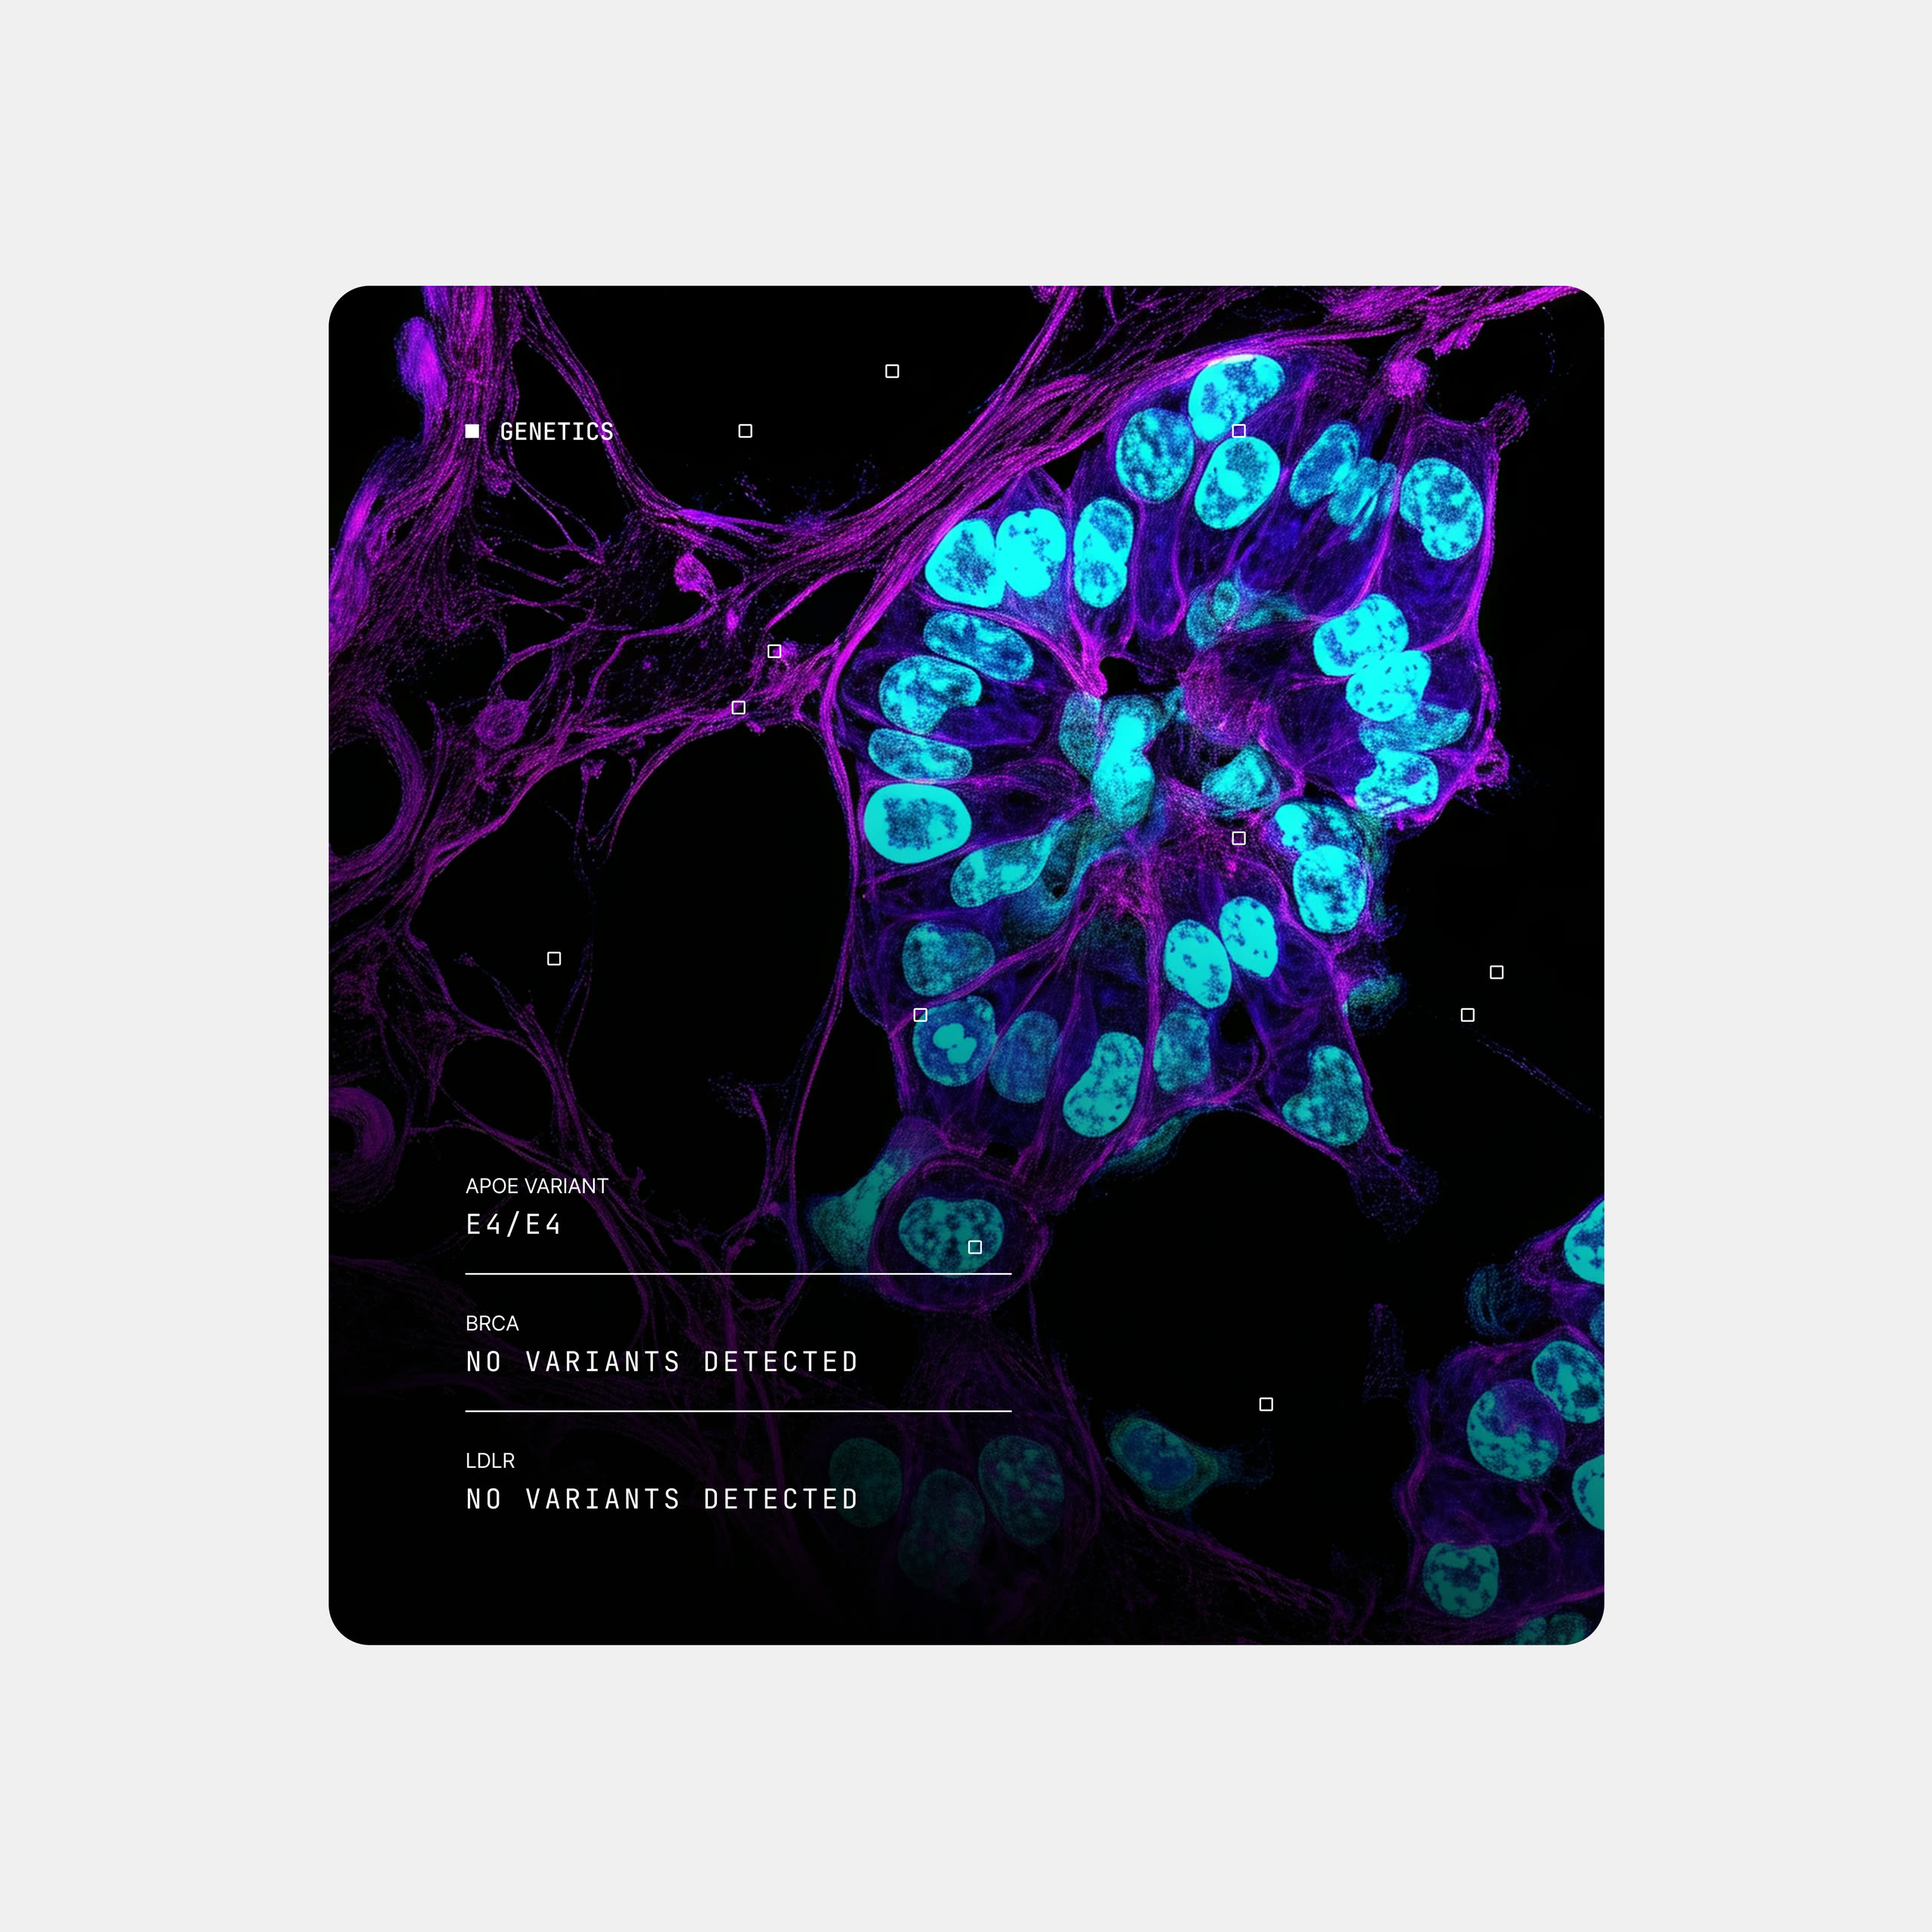
What to hold constant
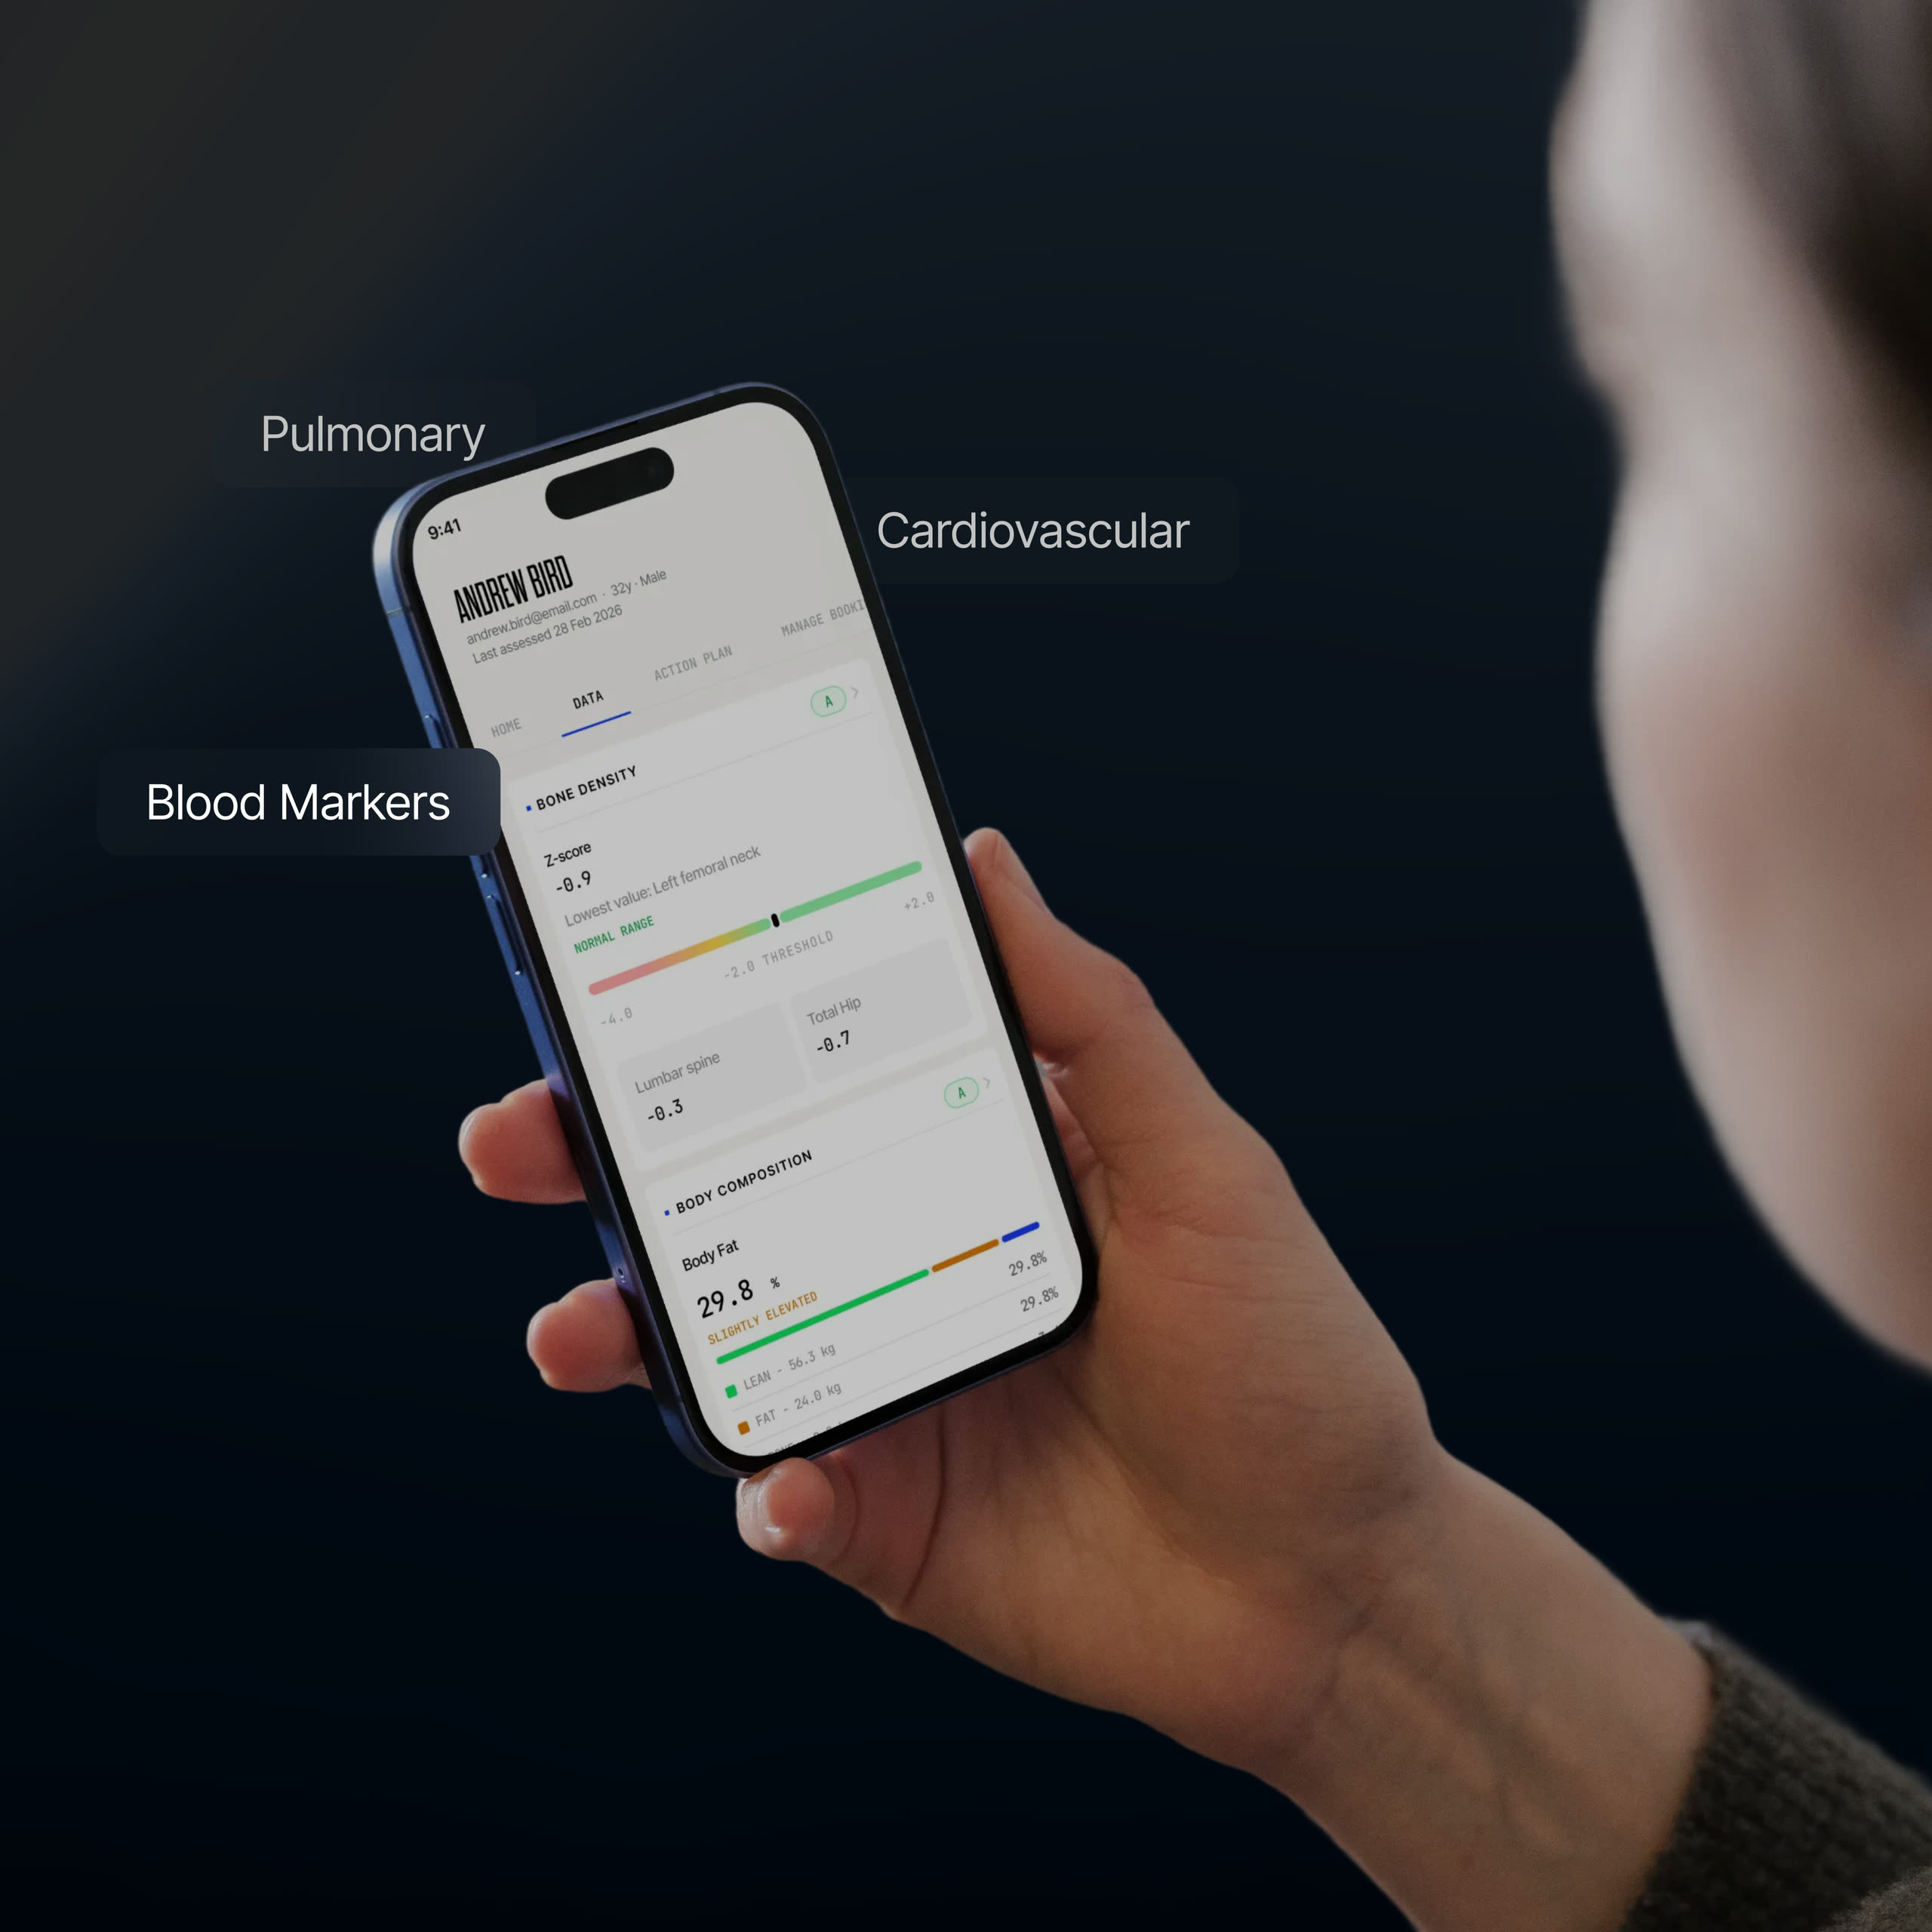
The hard part was not deciding what to show but what to hold constant. Every station measures something different, in units with nothing in common, and if each one invented its own layout the dashboard would read as a dozen separate products. So the cards share an order rather than a template: category and grade at the top, then the single value that matters most, a plain reading of it beside the number, and the supporting detail underneath. Only what the data needs changes. Keeping the outside fixed and the inside free is also what lets a new station join later without a redesign.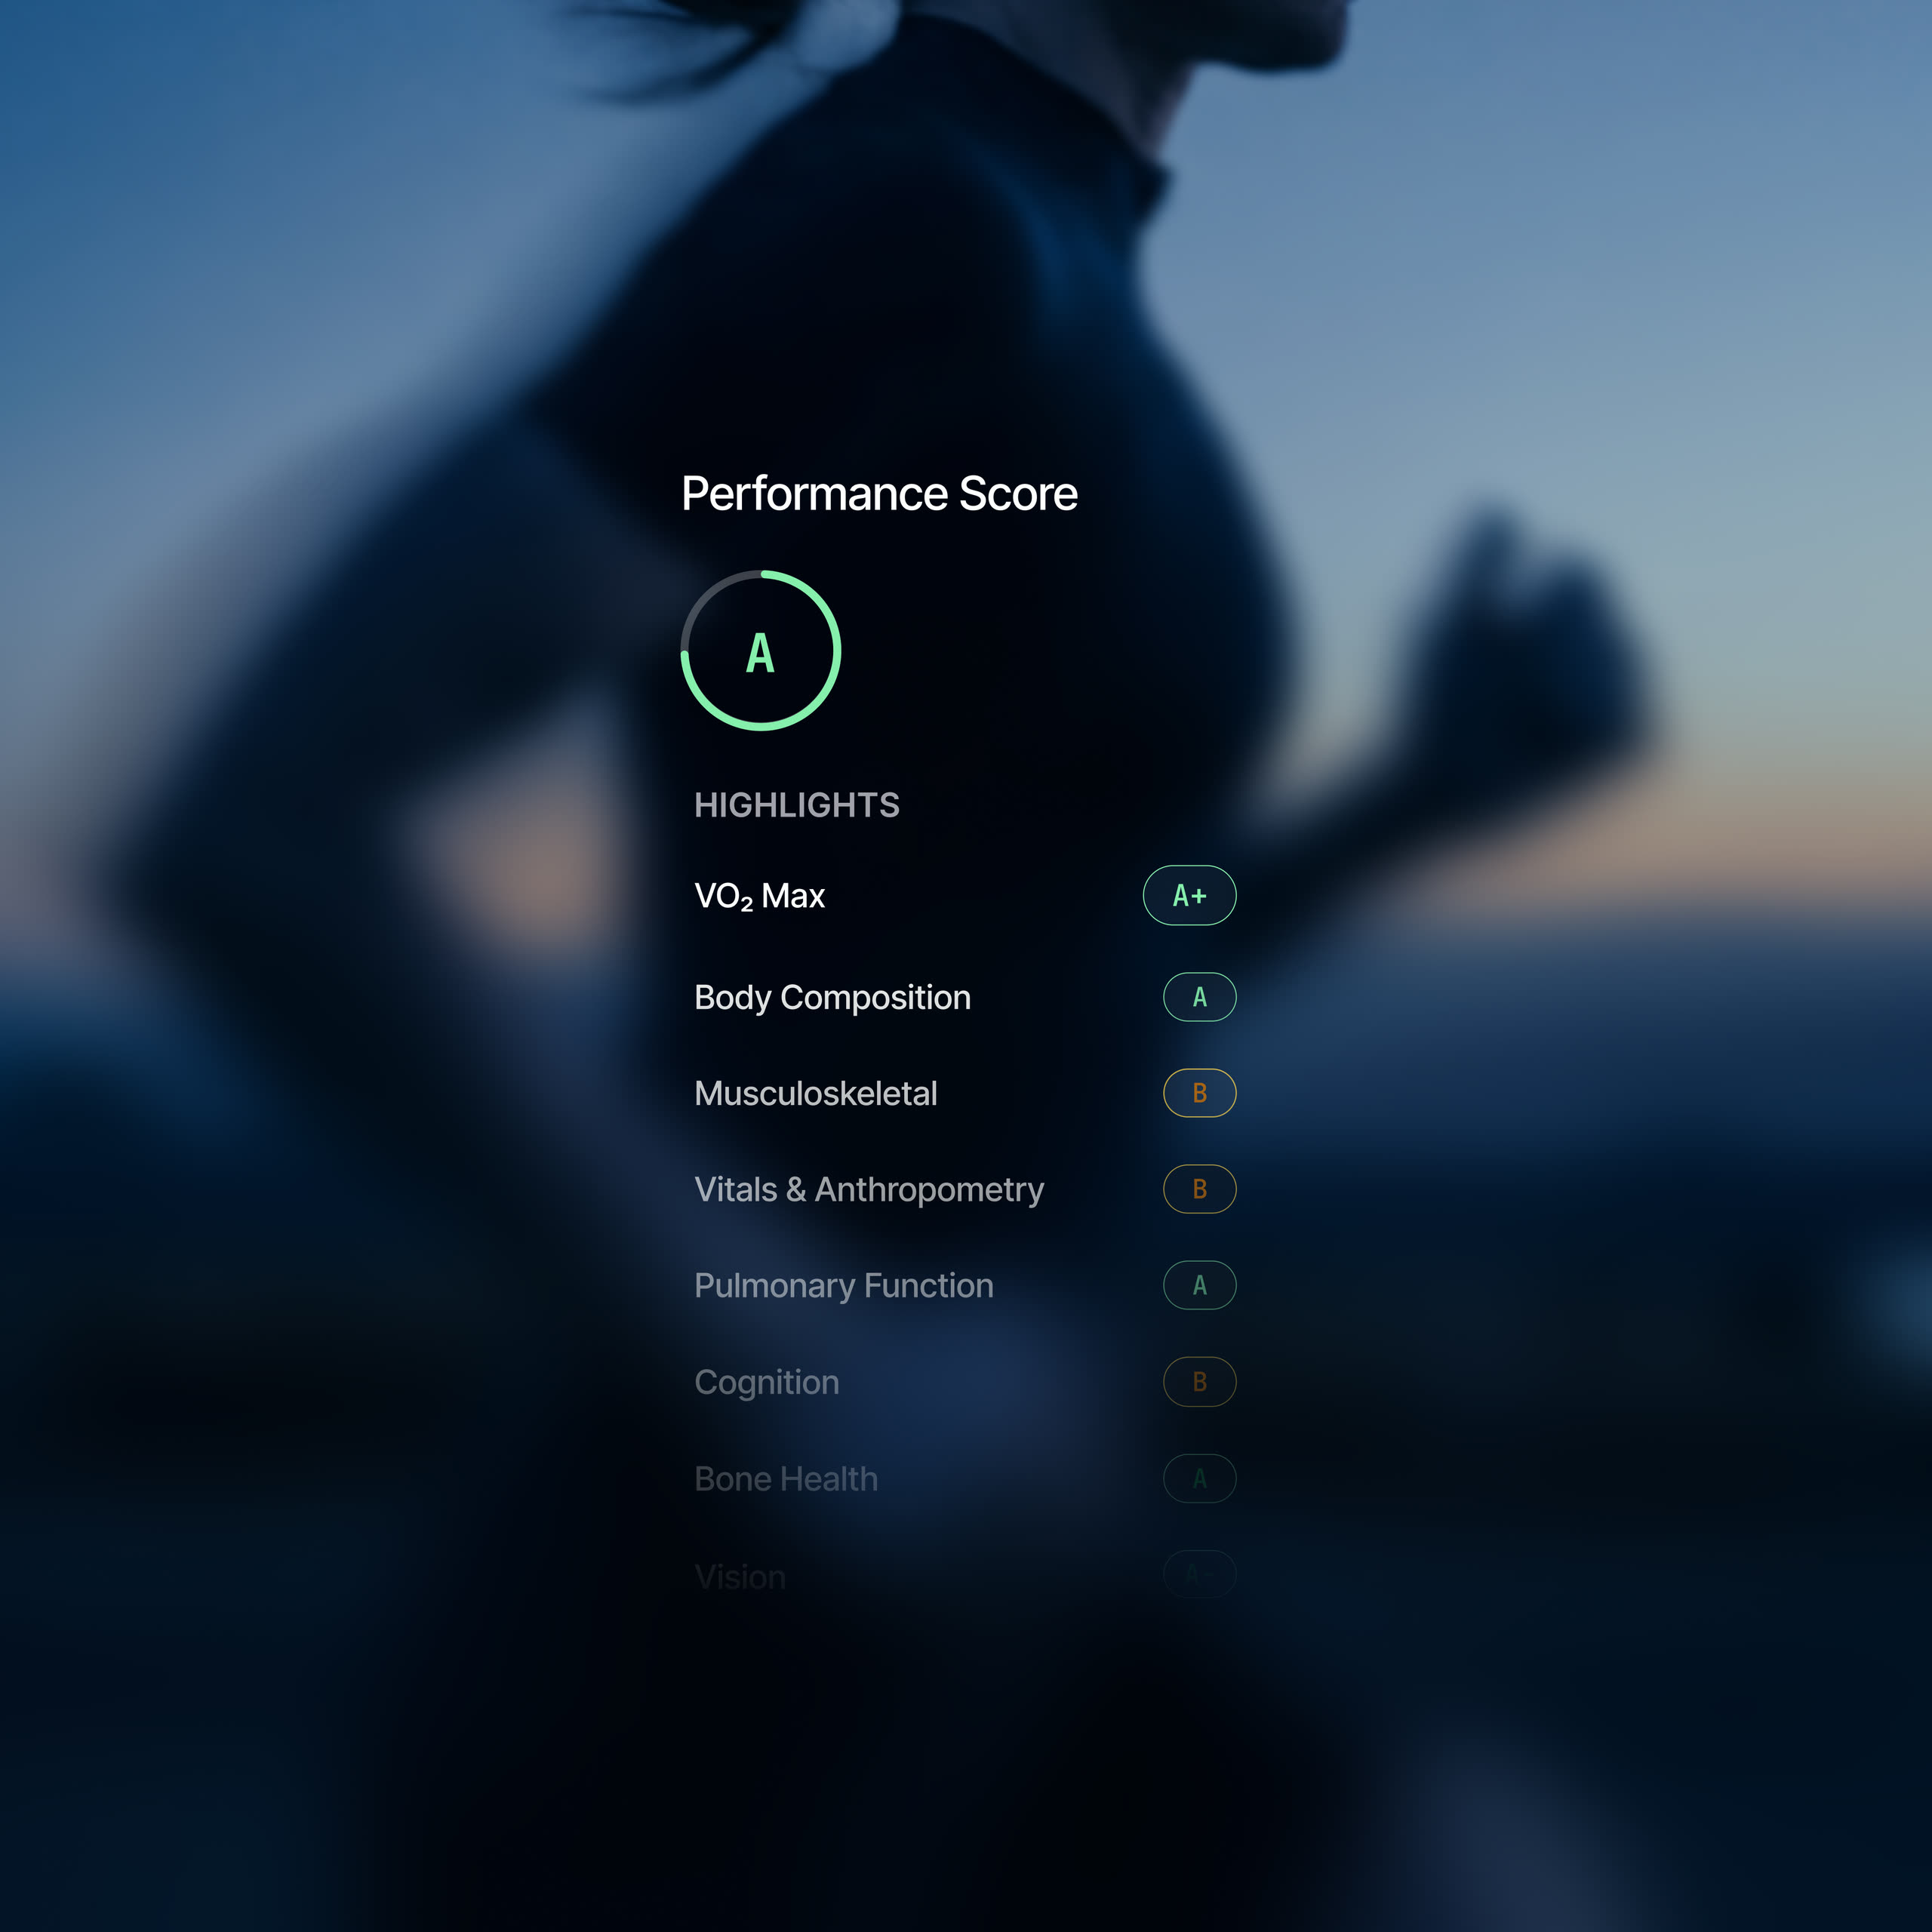
An illustration and a range
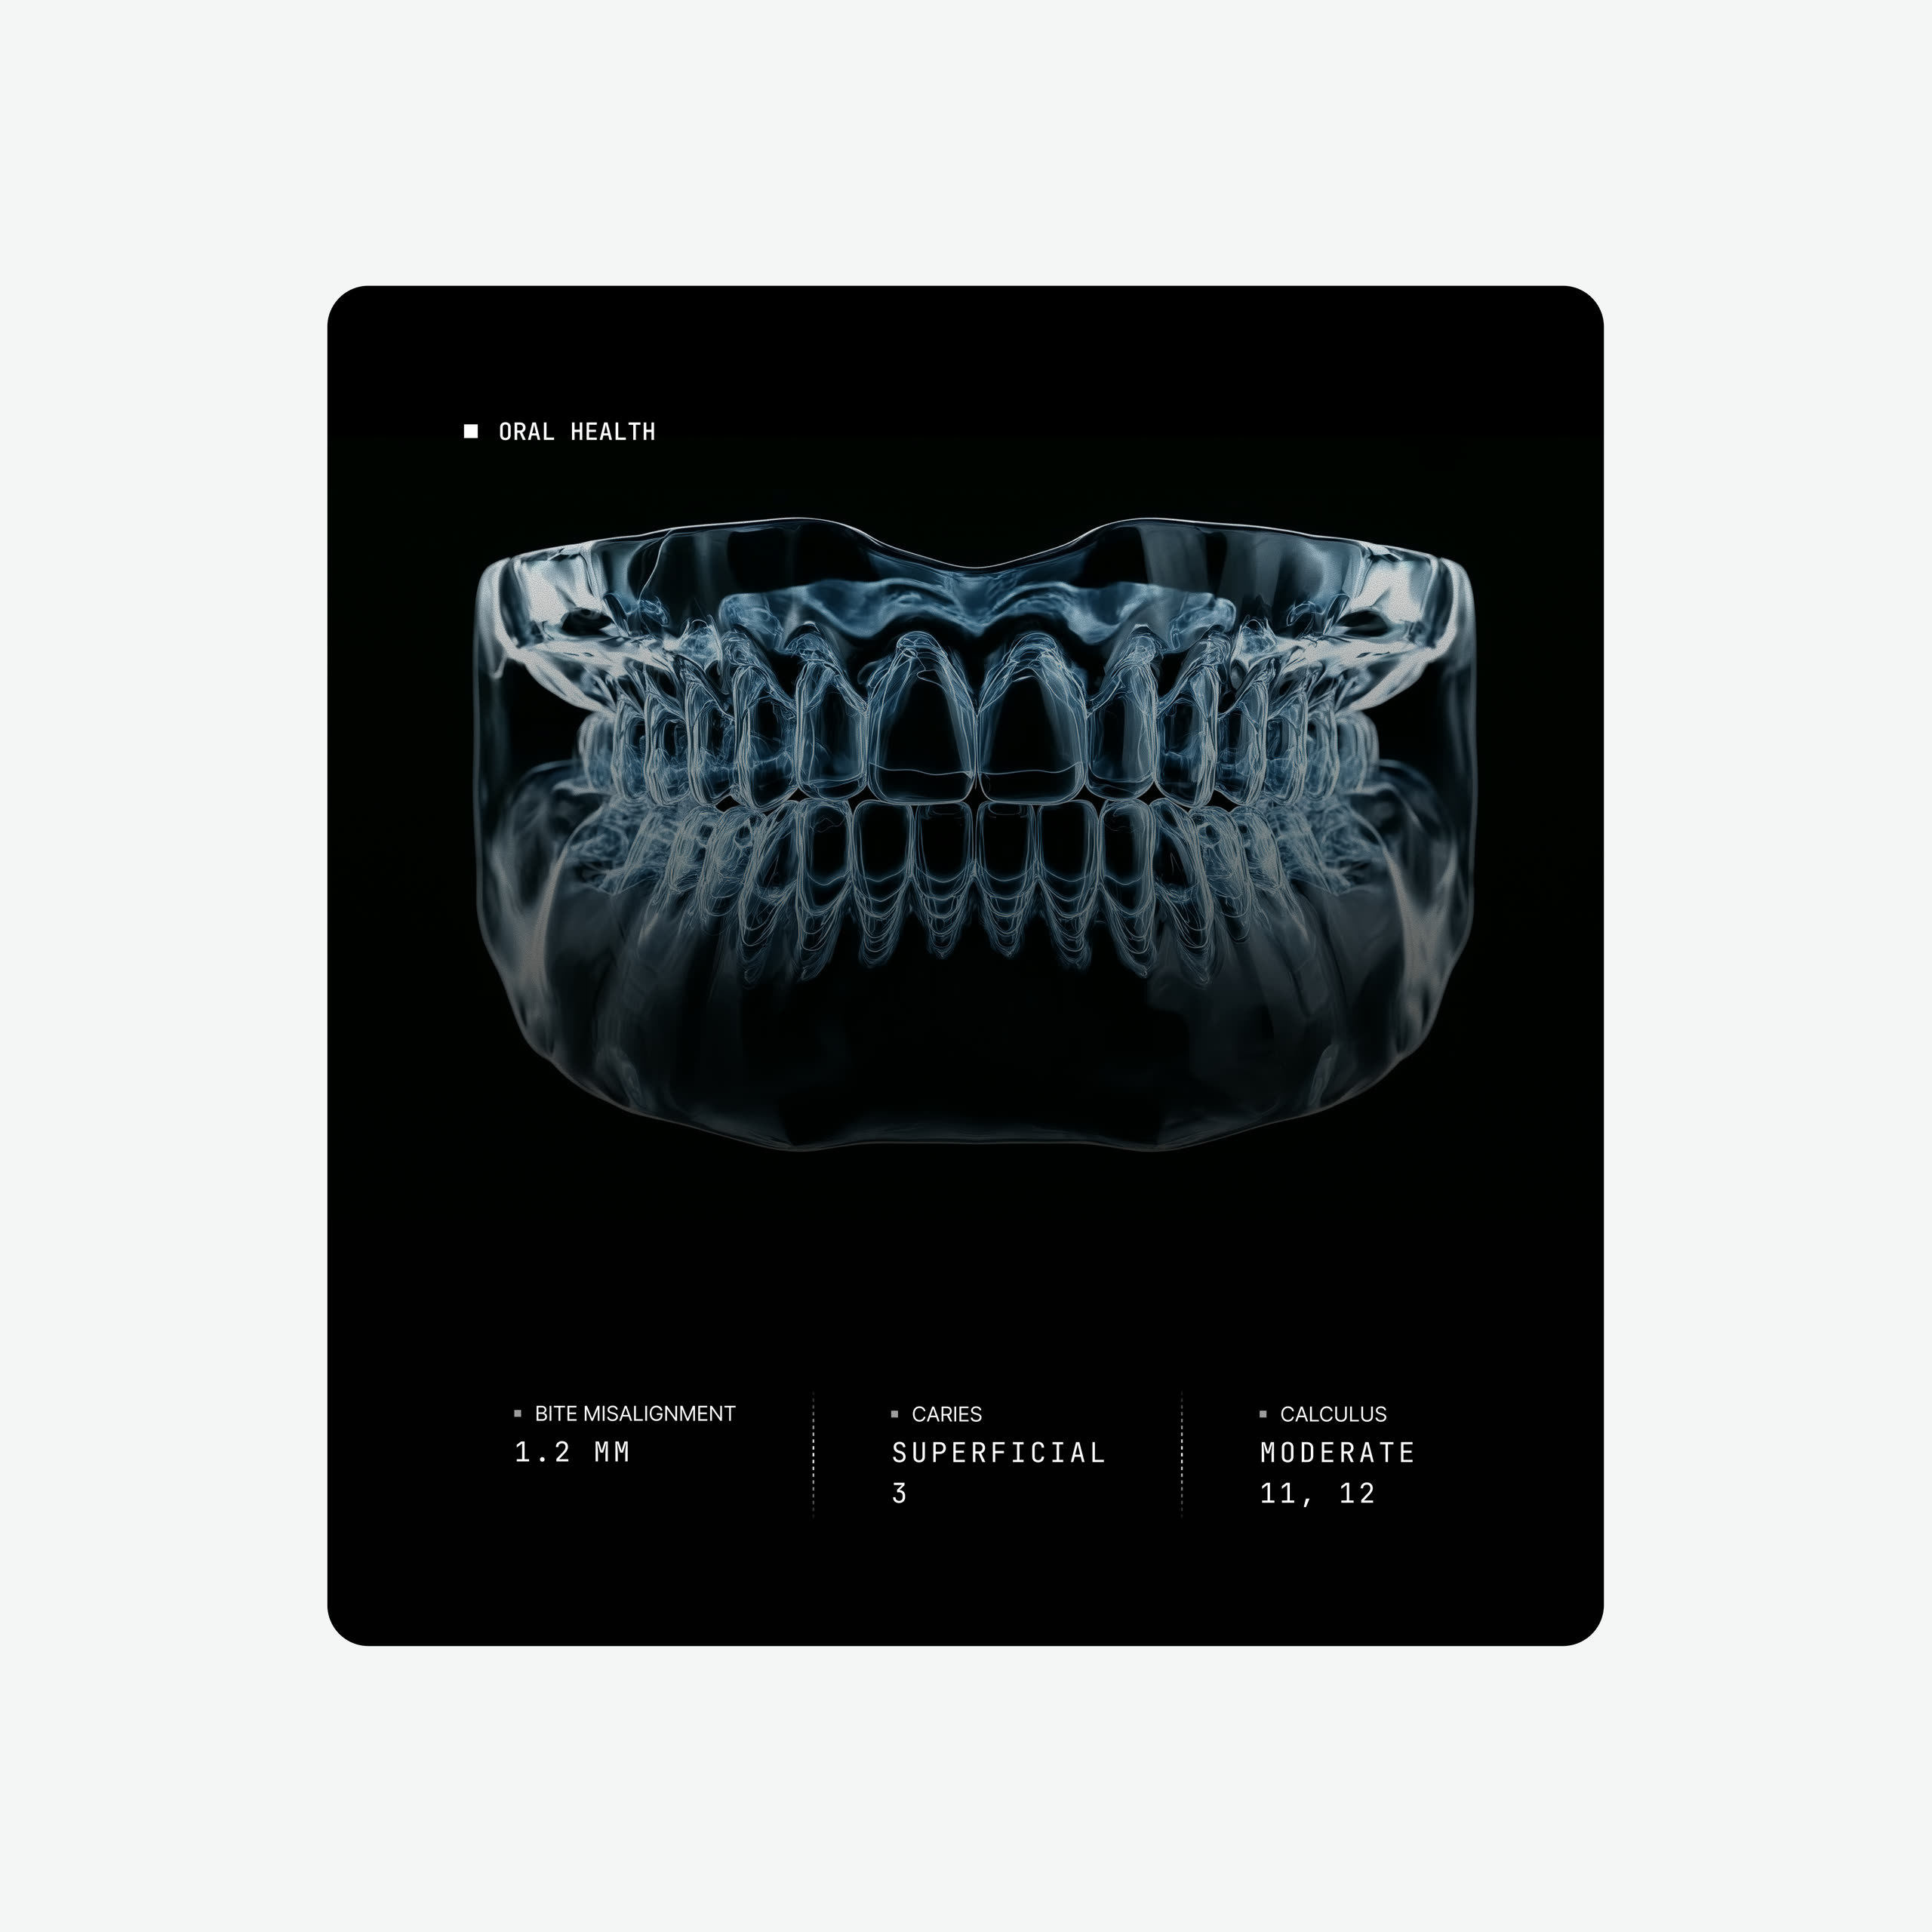
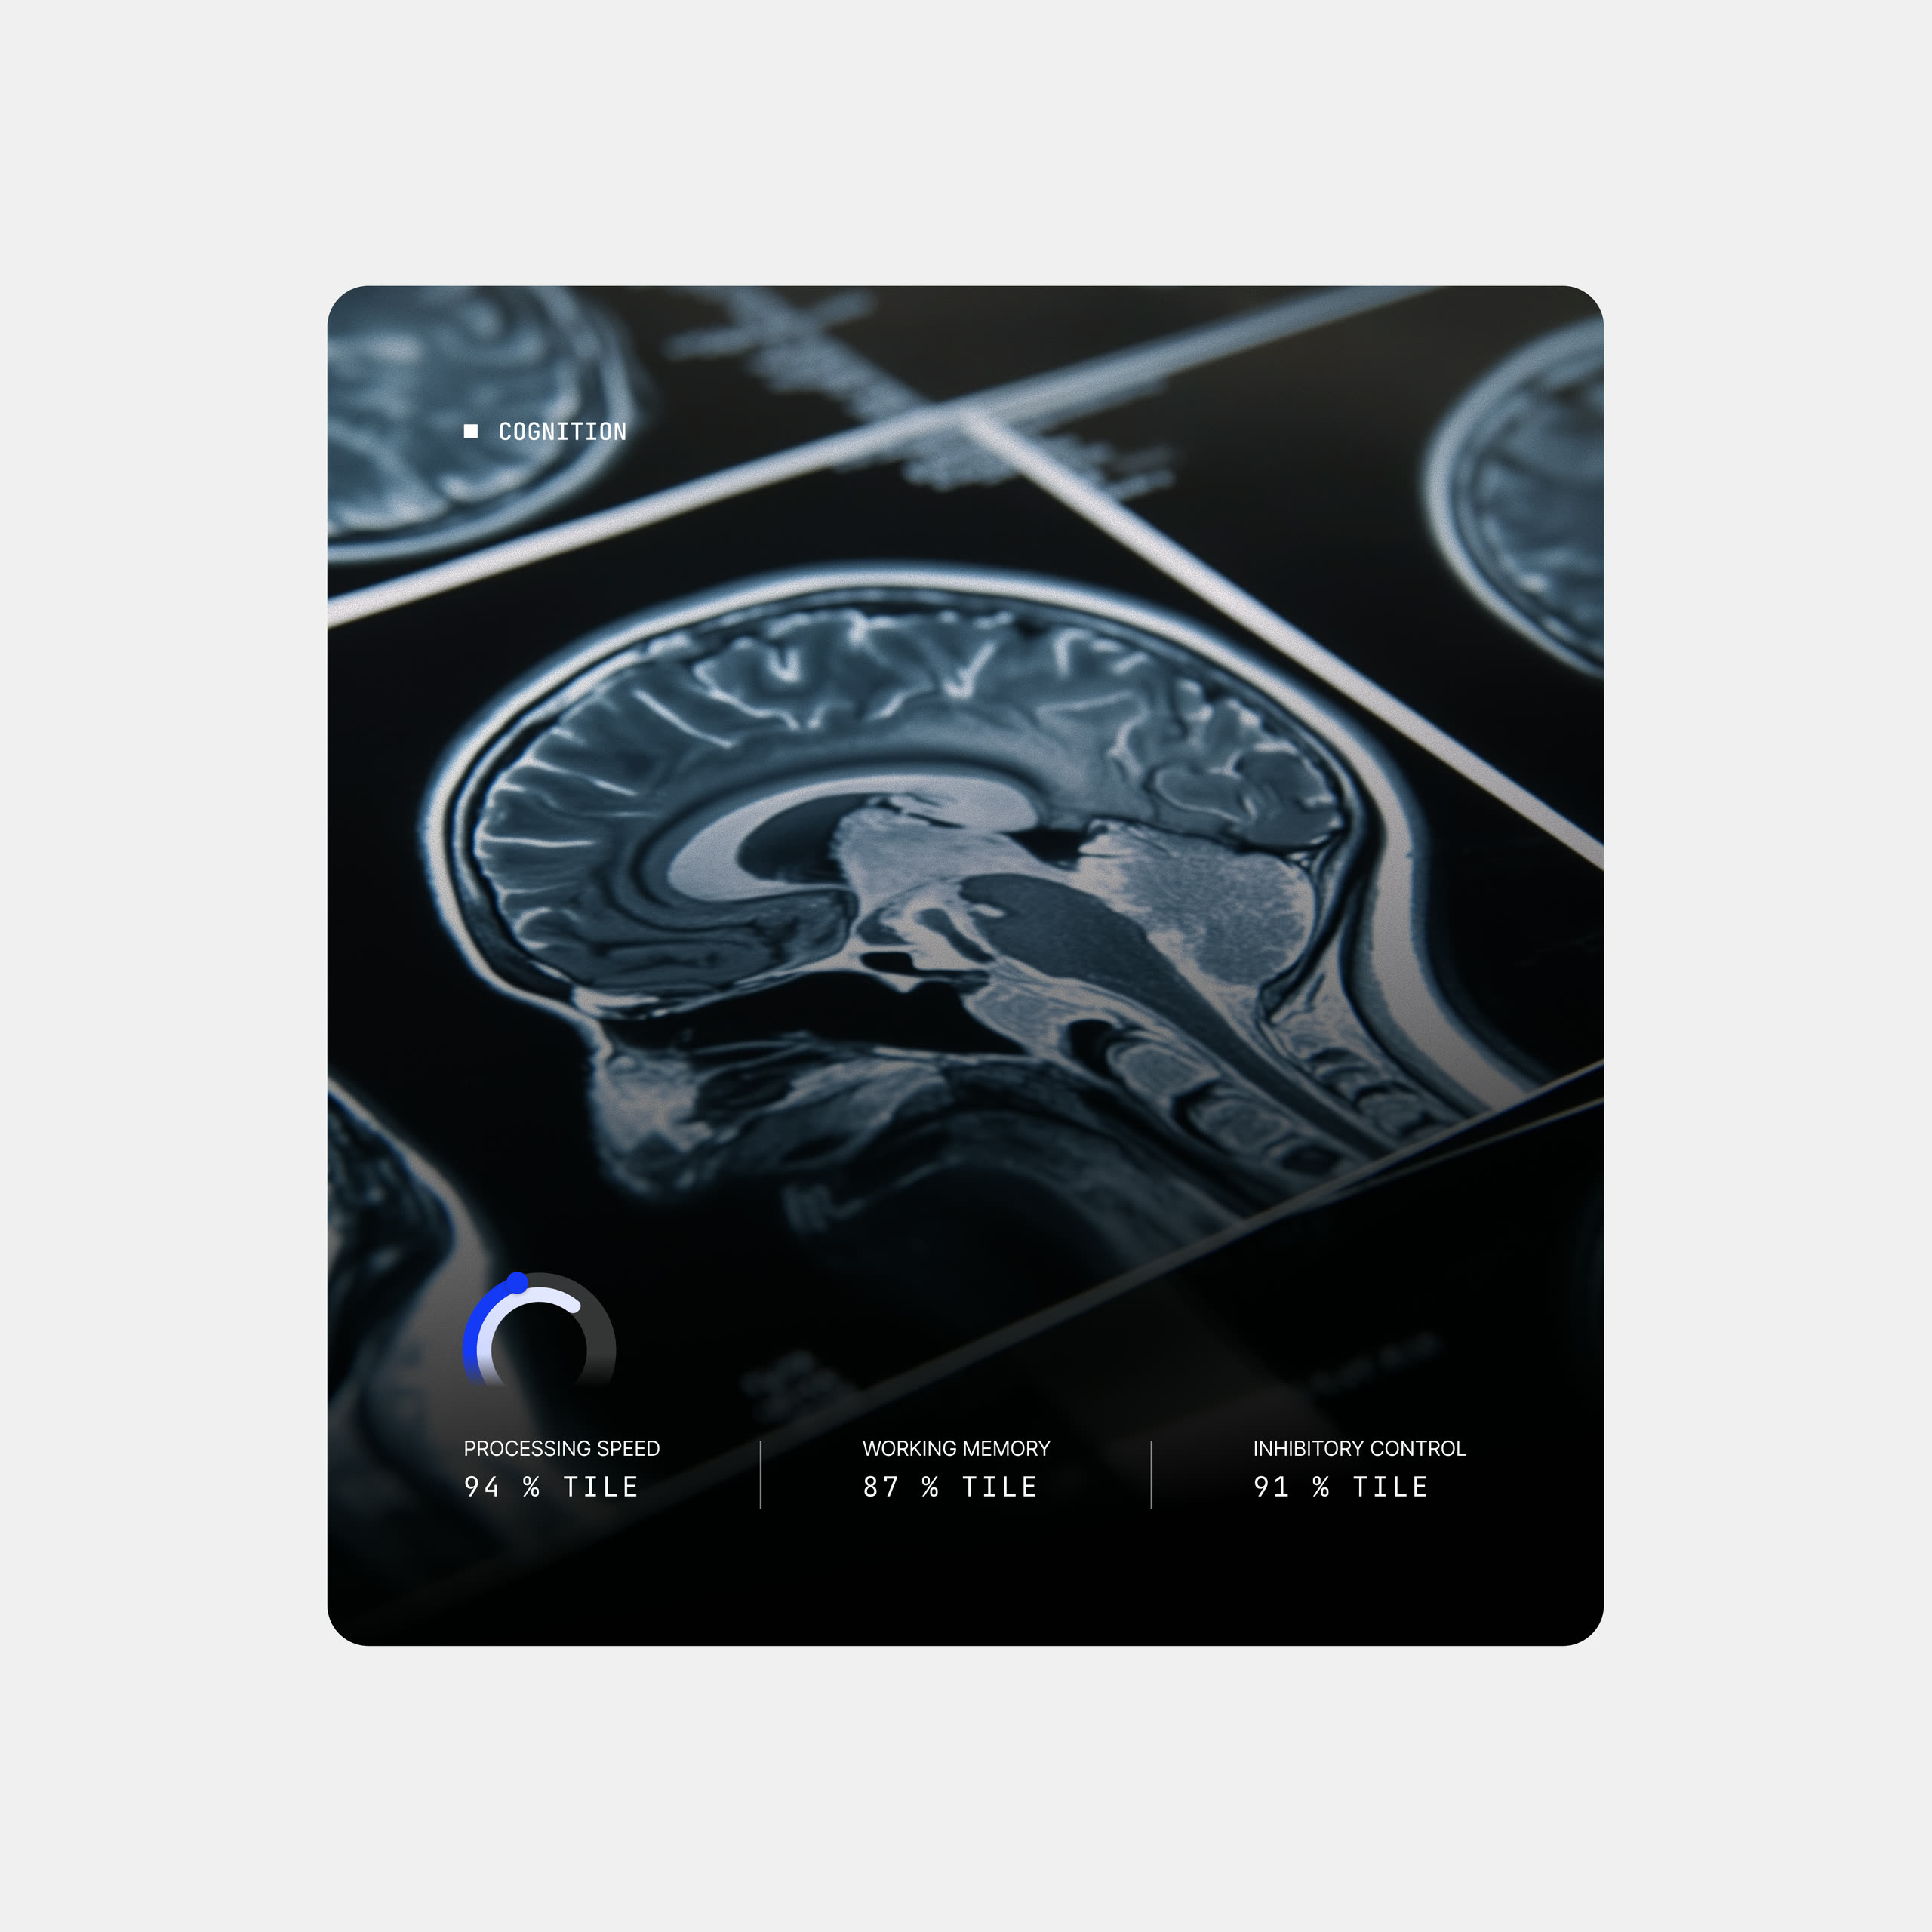
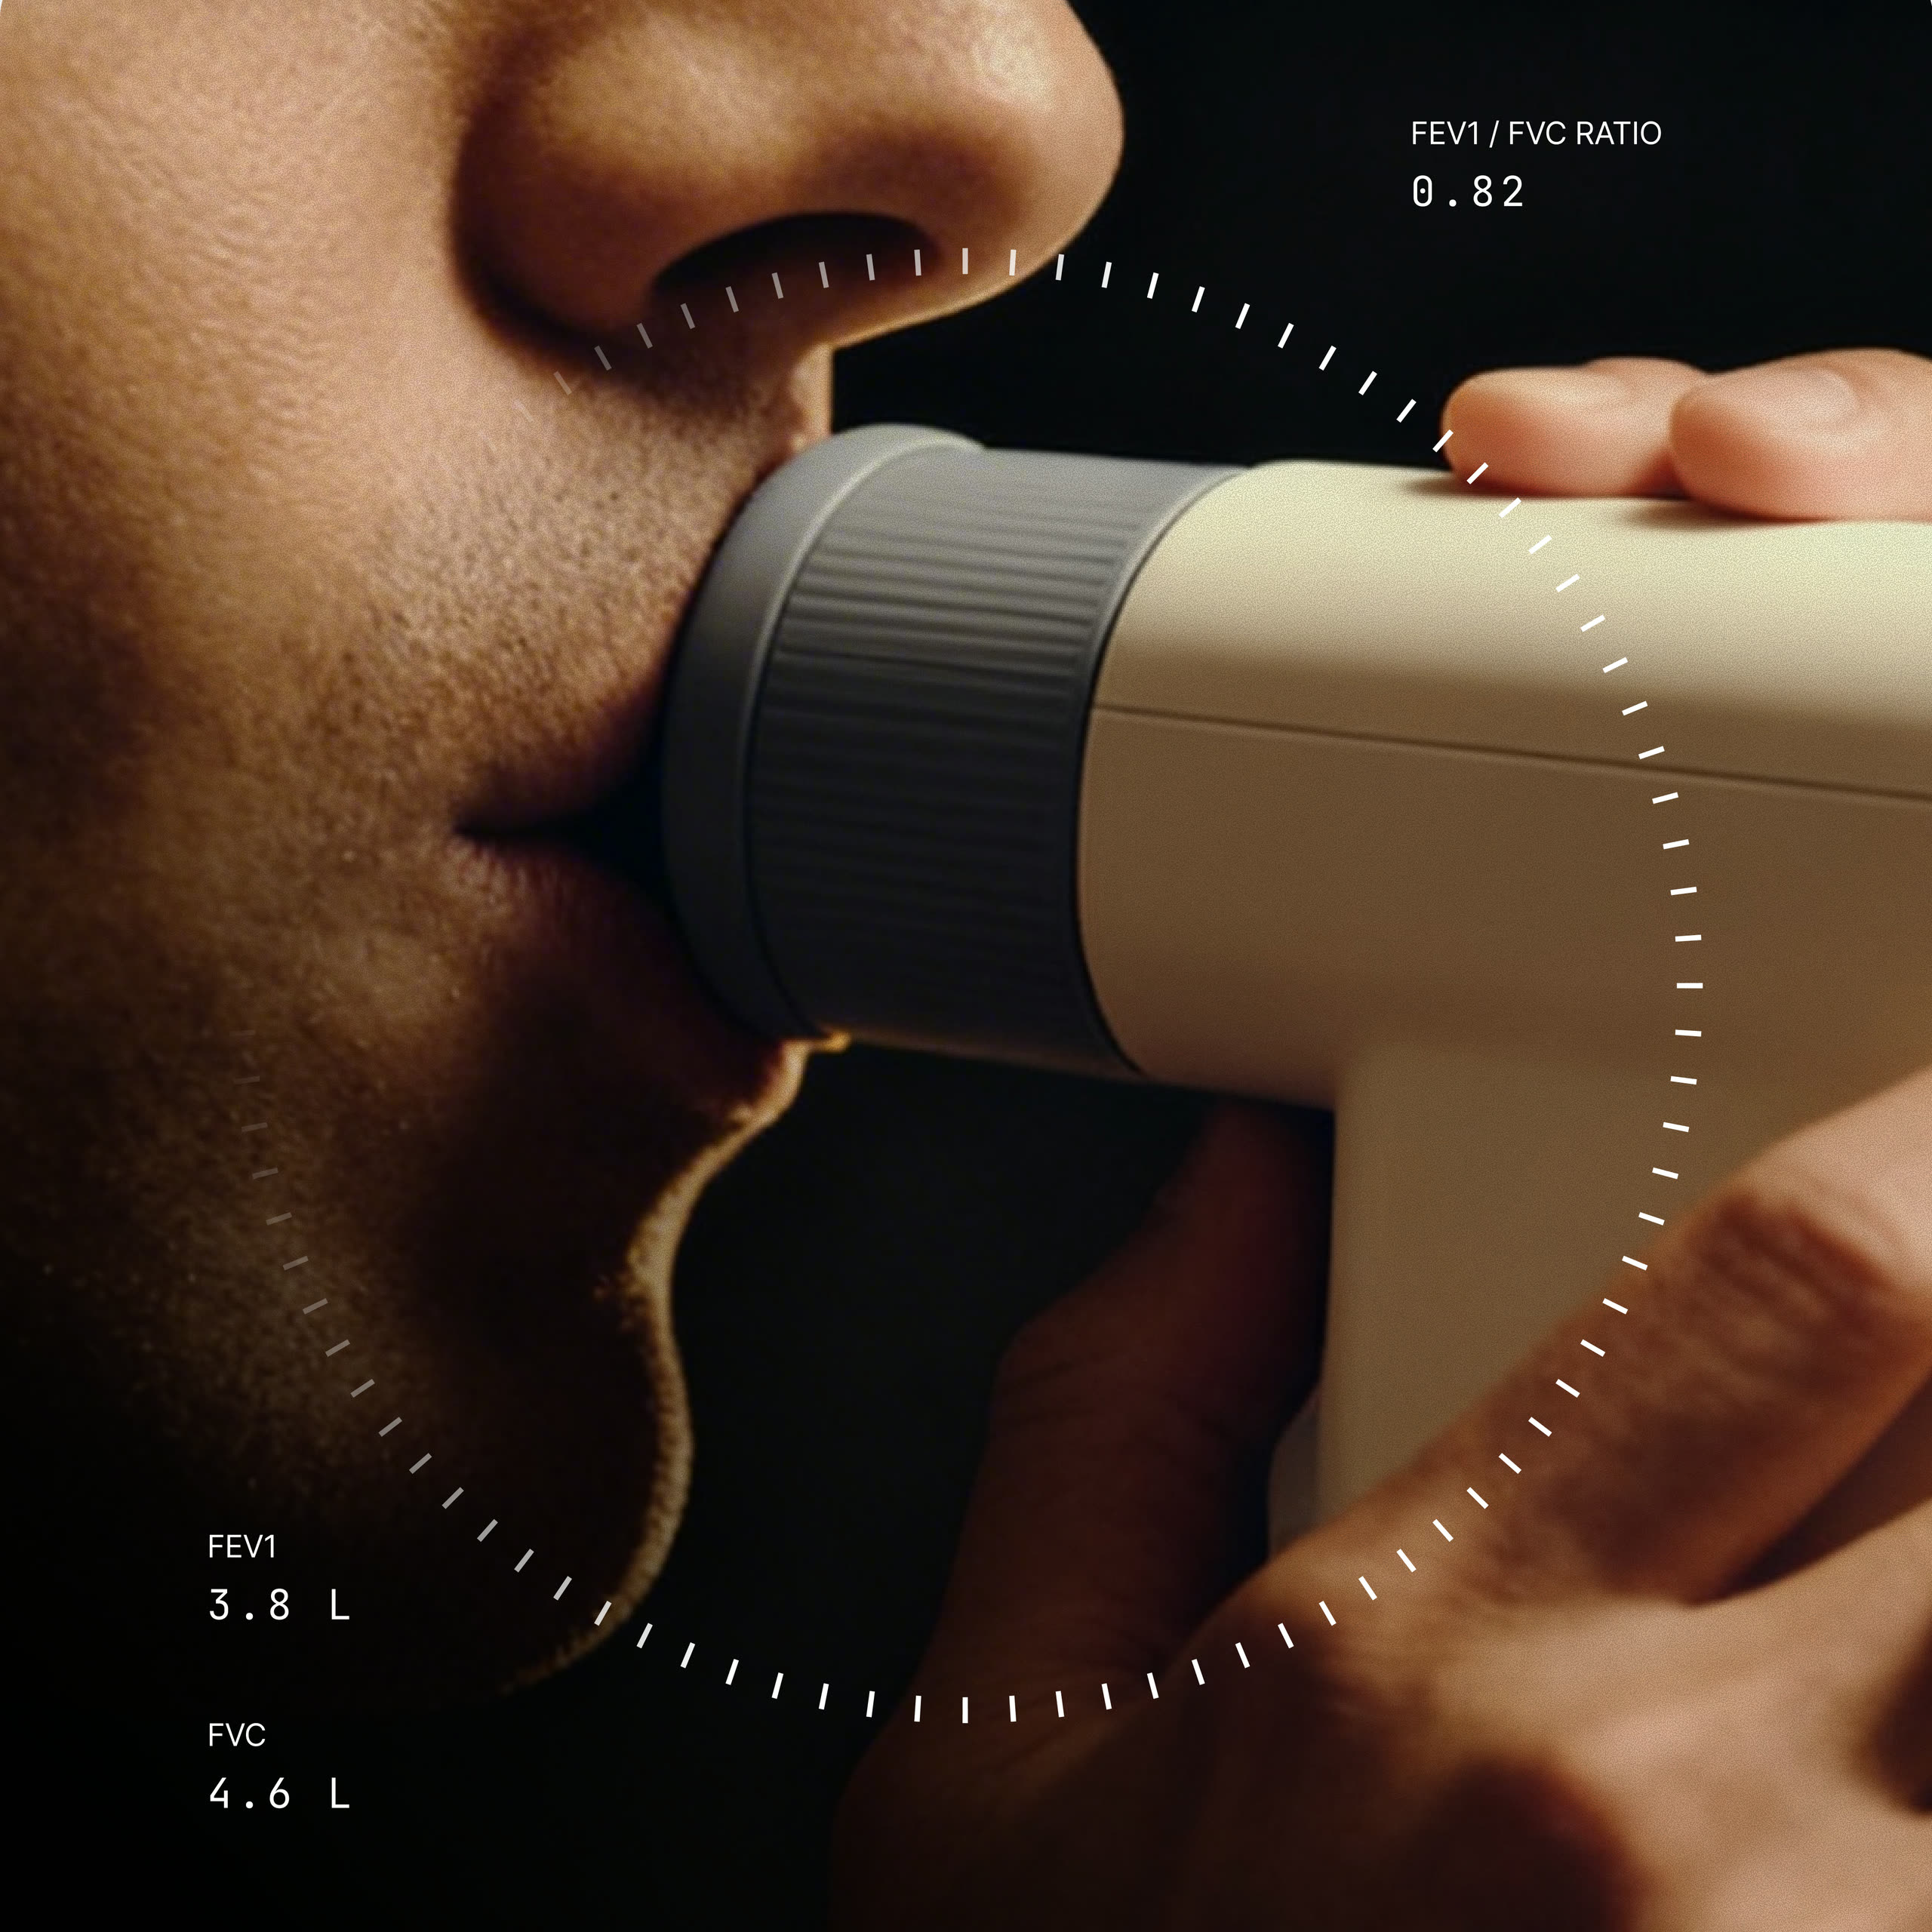
Two things sit inside that order and do more than they look like they do. Each card carries an illustration of the part of the body it reports on, which says what you are looking at before you have read a word and gives a surface of numbers somewhere for the eye to settle. And where a value has a healthy range it sits on a bar with the range drawn in, because a number on its own asks you to already know what good looks like, while a position on a scale shows you.The three points of a CPET
Aerobic threshold, anaerobic threshold and peak are the three points a CPET produces, and as words they mean almost nothing to most people. So the detail page makes them a selection rather than a table: choose one and the 3D figure changes with it, showing the effort that point represents instead of describing it in a caption. The clinical terms stay, because those are the words a physiologist will use with you afterwards, but the figure is what makes them legible the first time you meet them. It is the same thinking as the range bar. A threshold is a boundary, and a boundary is easier to grasp when you are shown which side of it you are on.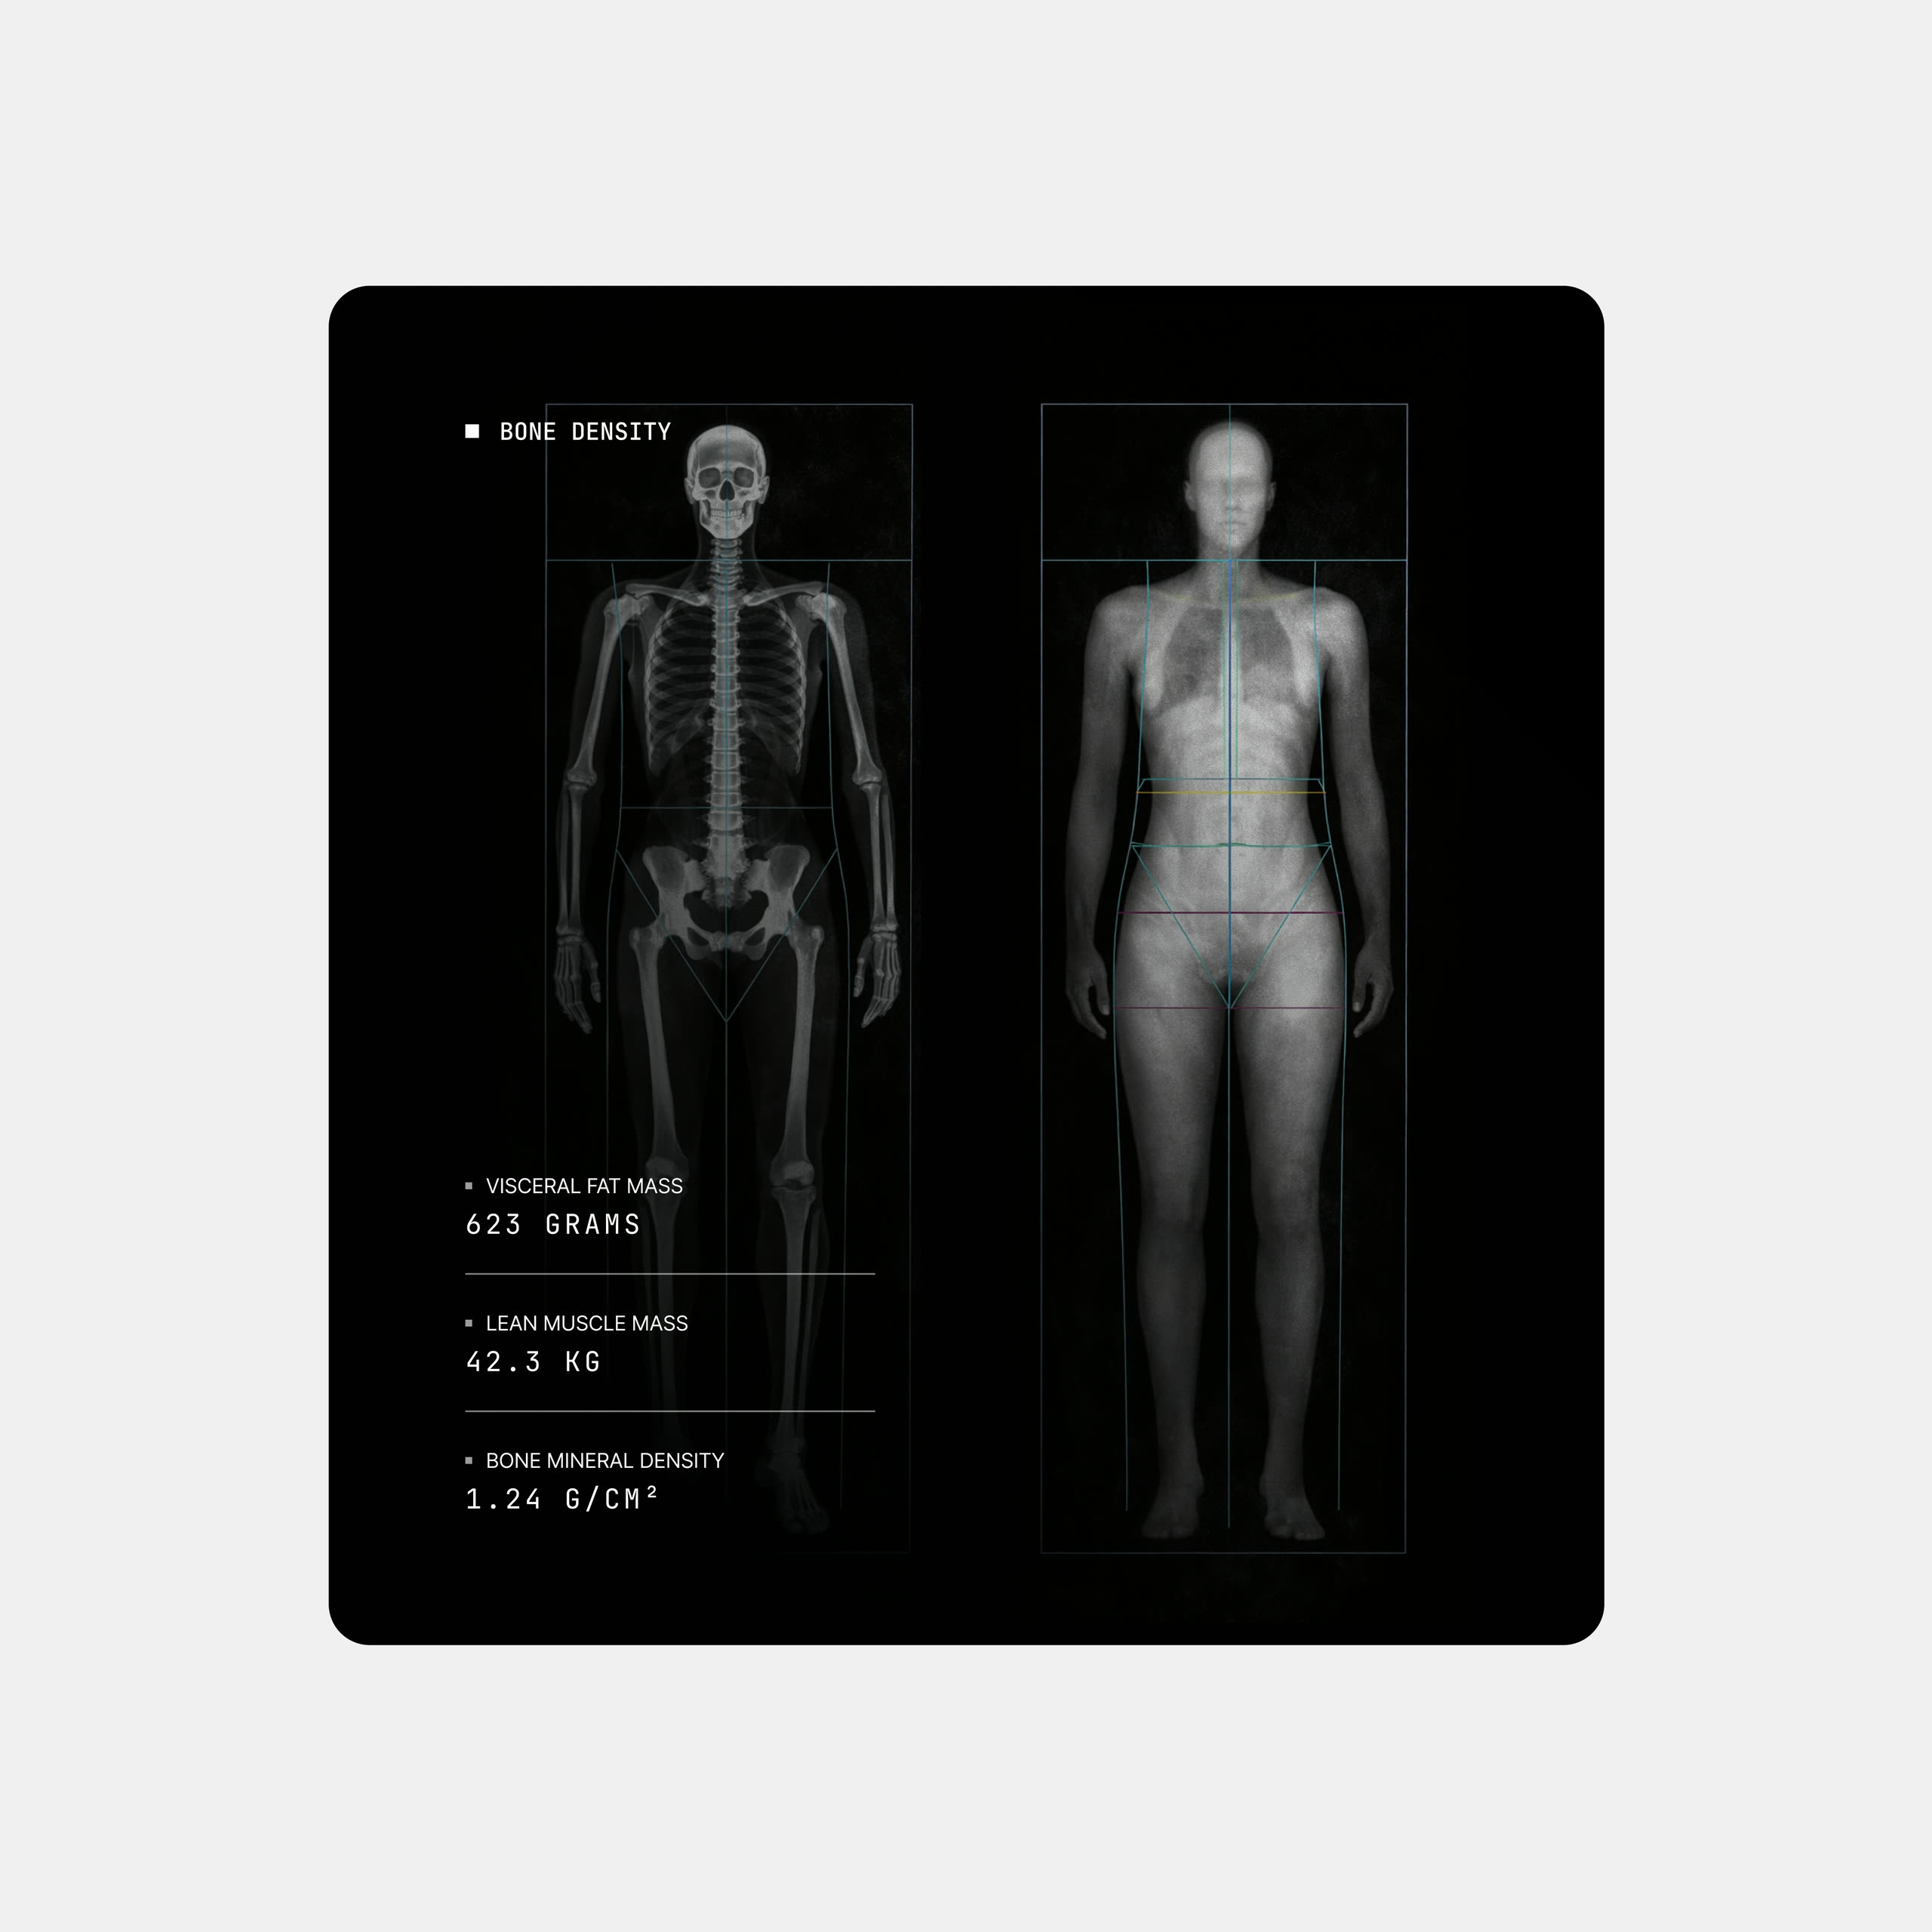
Placing a site on a body
Bone density is reported one site at a time, and a site name is not something most people can place on their own body. So the model here works the way the one on the overview does: choose a site and the bone it refers to lights up on the skeleton. It turns a row in a list into somewhere you can point at, which is the difference between reading that a value is low and understanding where it is low.The audiogram, kept
A hearing result is normally an audiogram, which is a chart you have to be taught to read. That chart is still there on a tab for anyone who wants it, but the default is a map you can move through. Drag the frequency slider and both ears respond together, so you are always comparing left against right at the same pitch, and each threshold sits on an arc with the bands drawn in rather than being quoted as a number. The preview plays the frequency you are looking at, which is the one place in the dashboard where a measurement can be heard rather than read. Hearing is the easiest result to make real, because the test is the sound itself.What not to hide
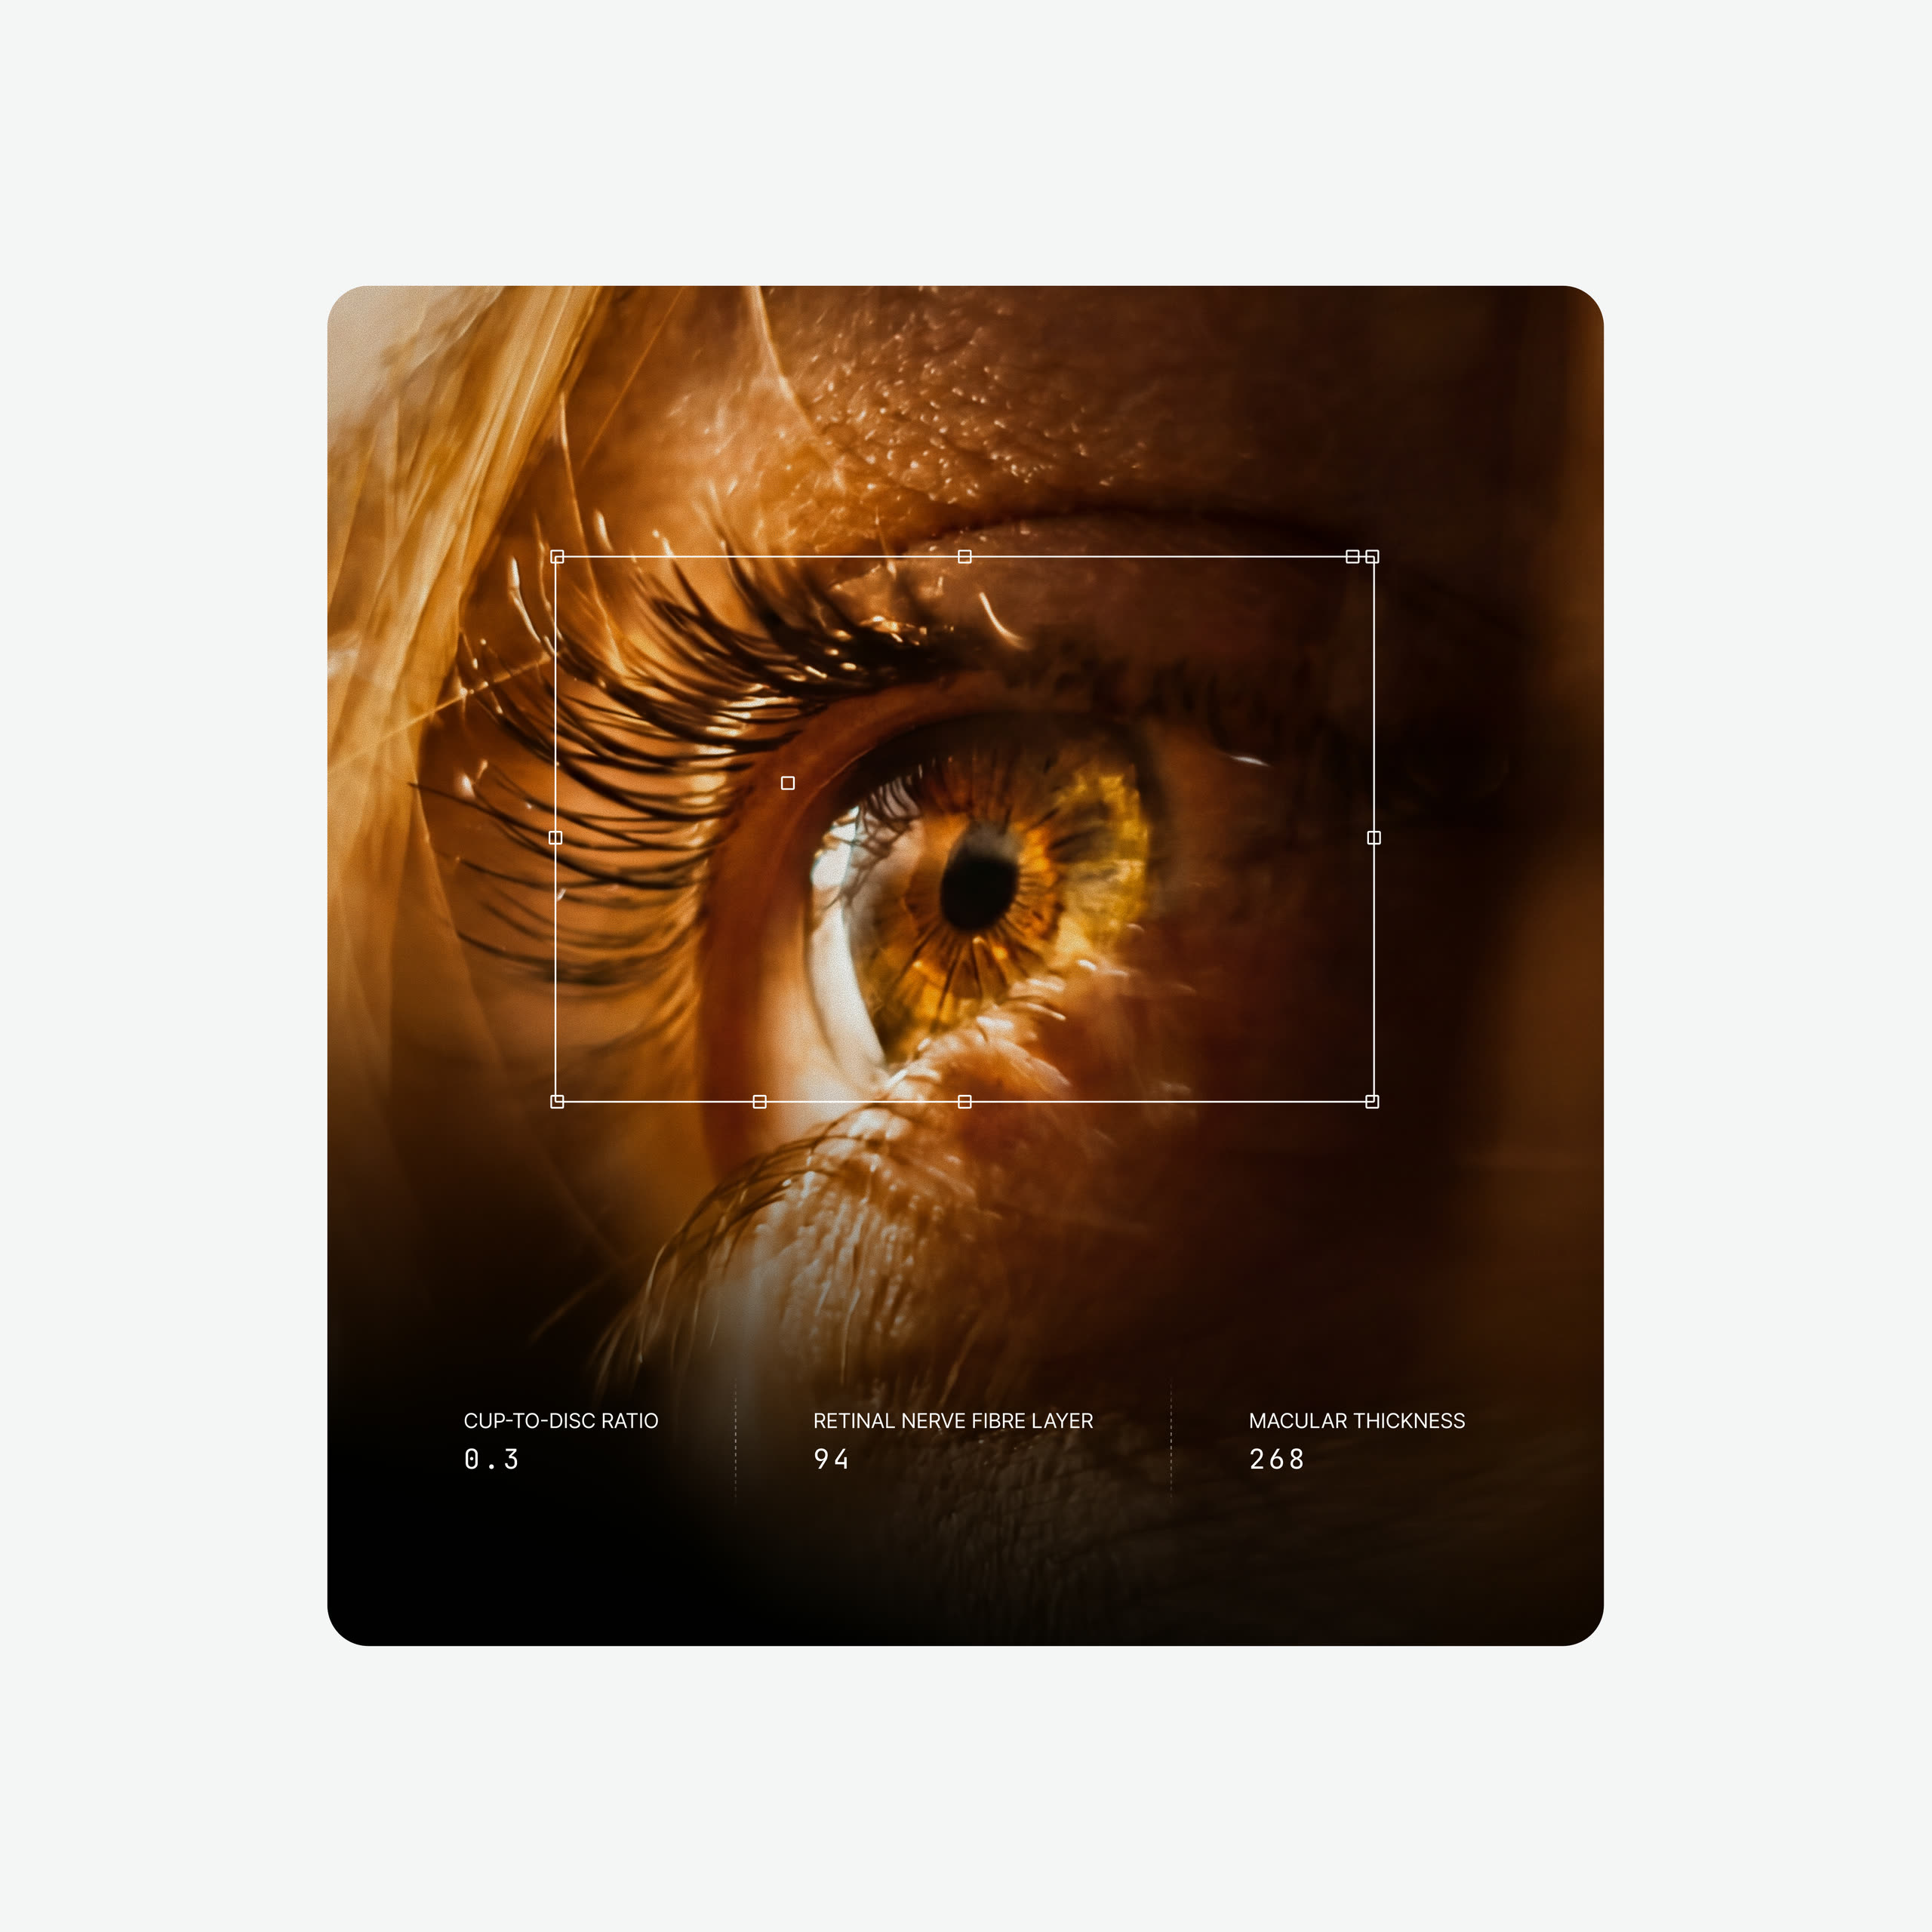
Most of what an eye exam produces is imagery: a photograph of the retina, a vessel map, a cross-section of the macula. The easy route is to hide all of it behind a number, because raw clinical images look like something has gone wrong even when nothing has. They are kept here, at full size, because they are the most convincing thing in the report. What changed is the framing. Each scan sits in its own panel with the measurement it produced beside it, the crops are consistent, and nothing is tinted or stylised. The image stays exactly what the machine captured, and the page around it is what makes it approachable.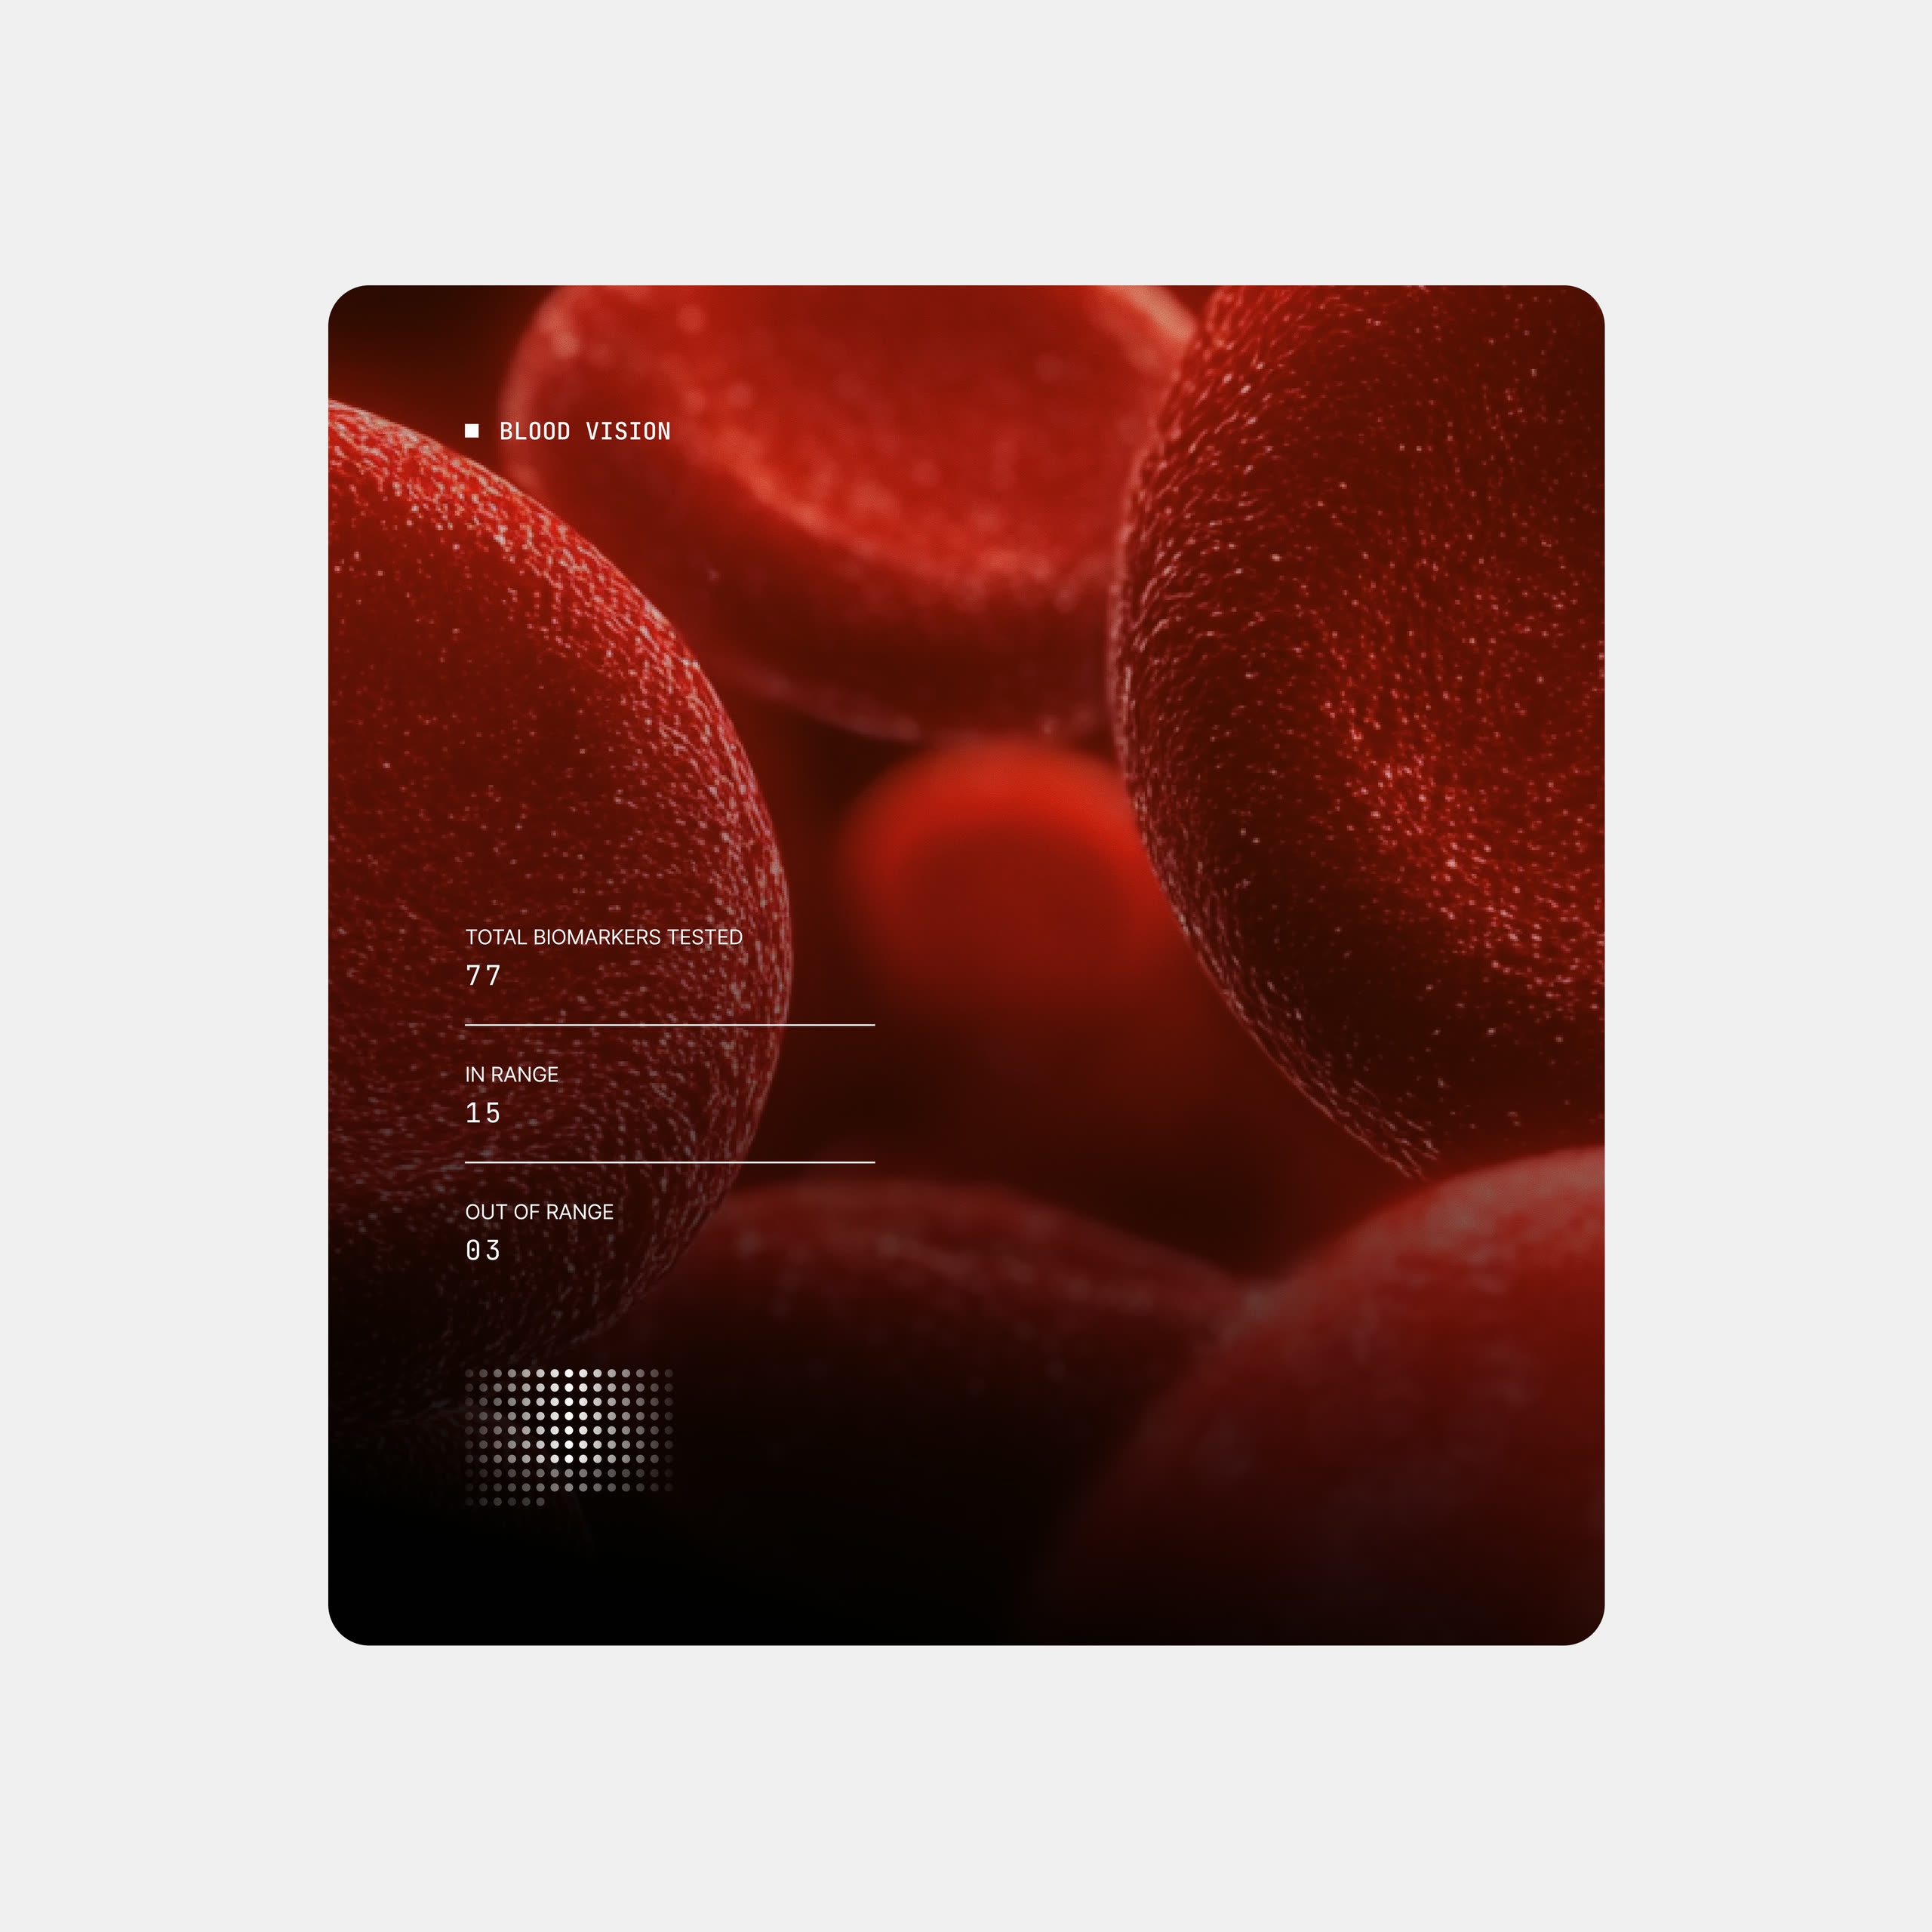
From result to action
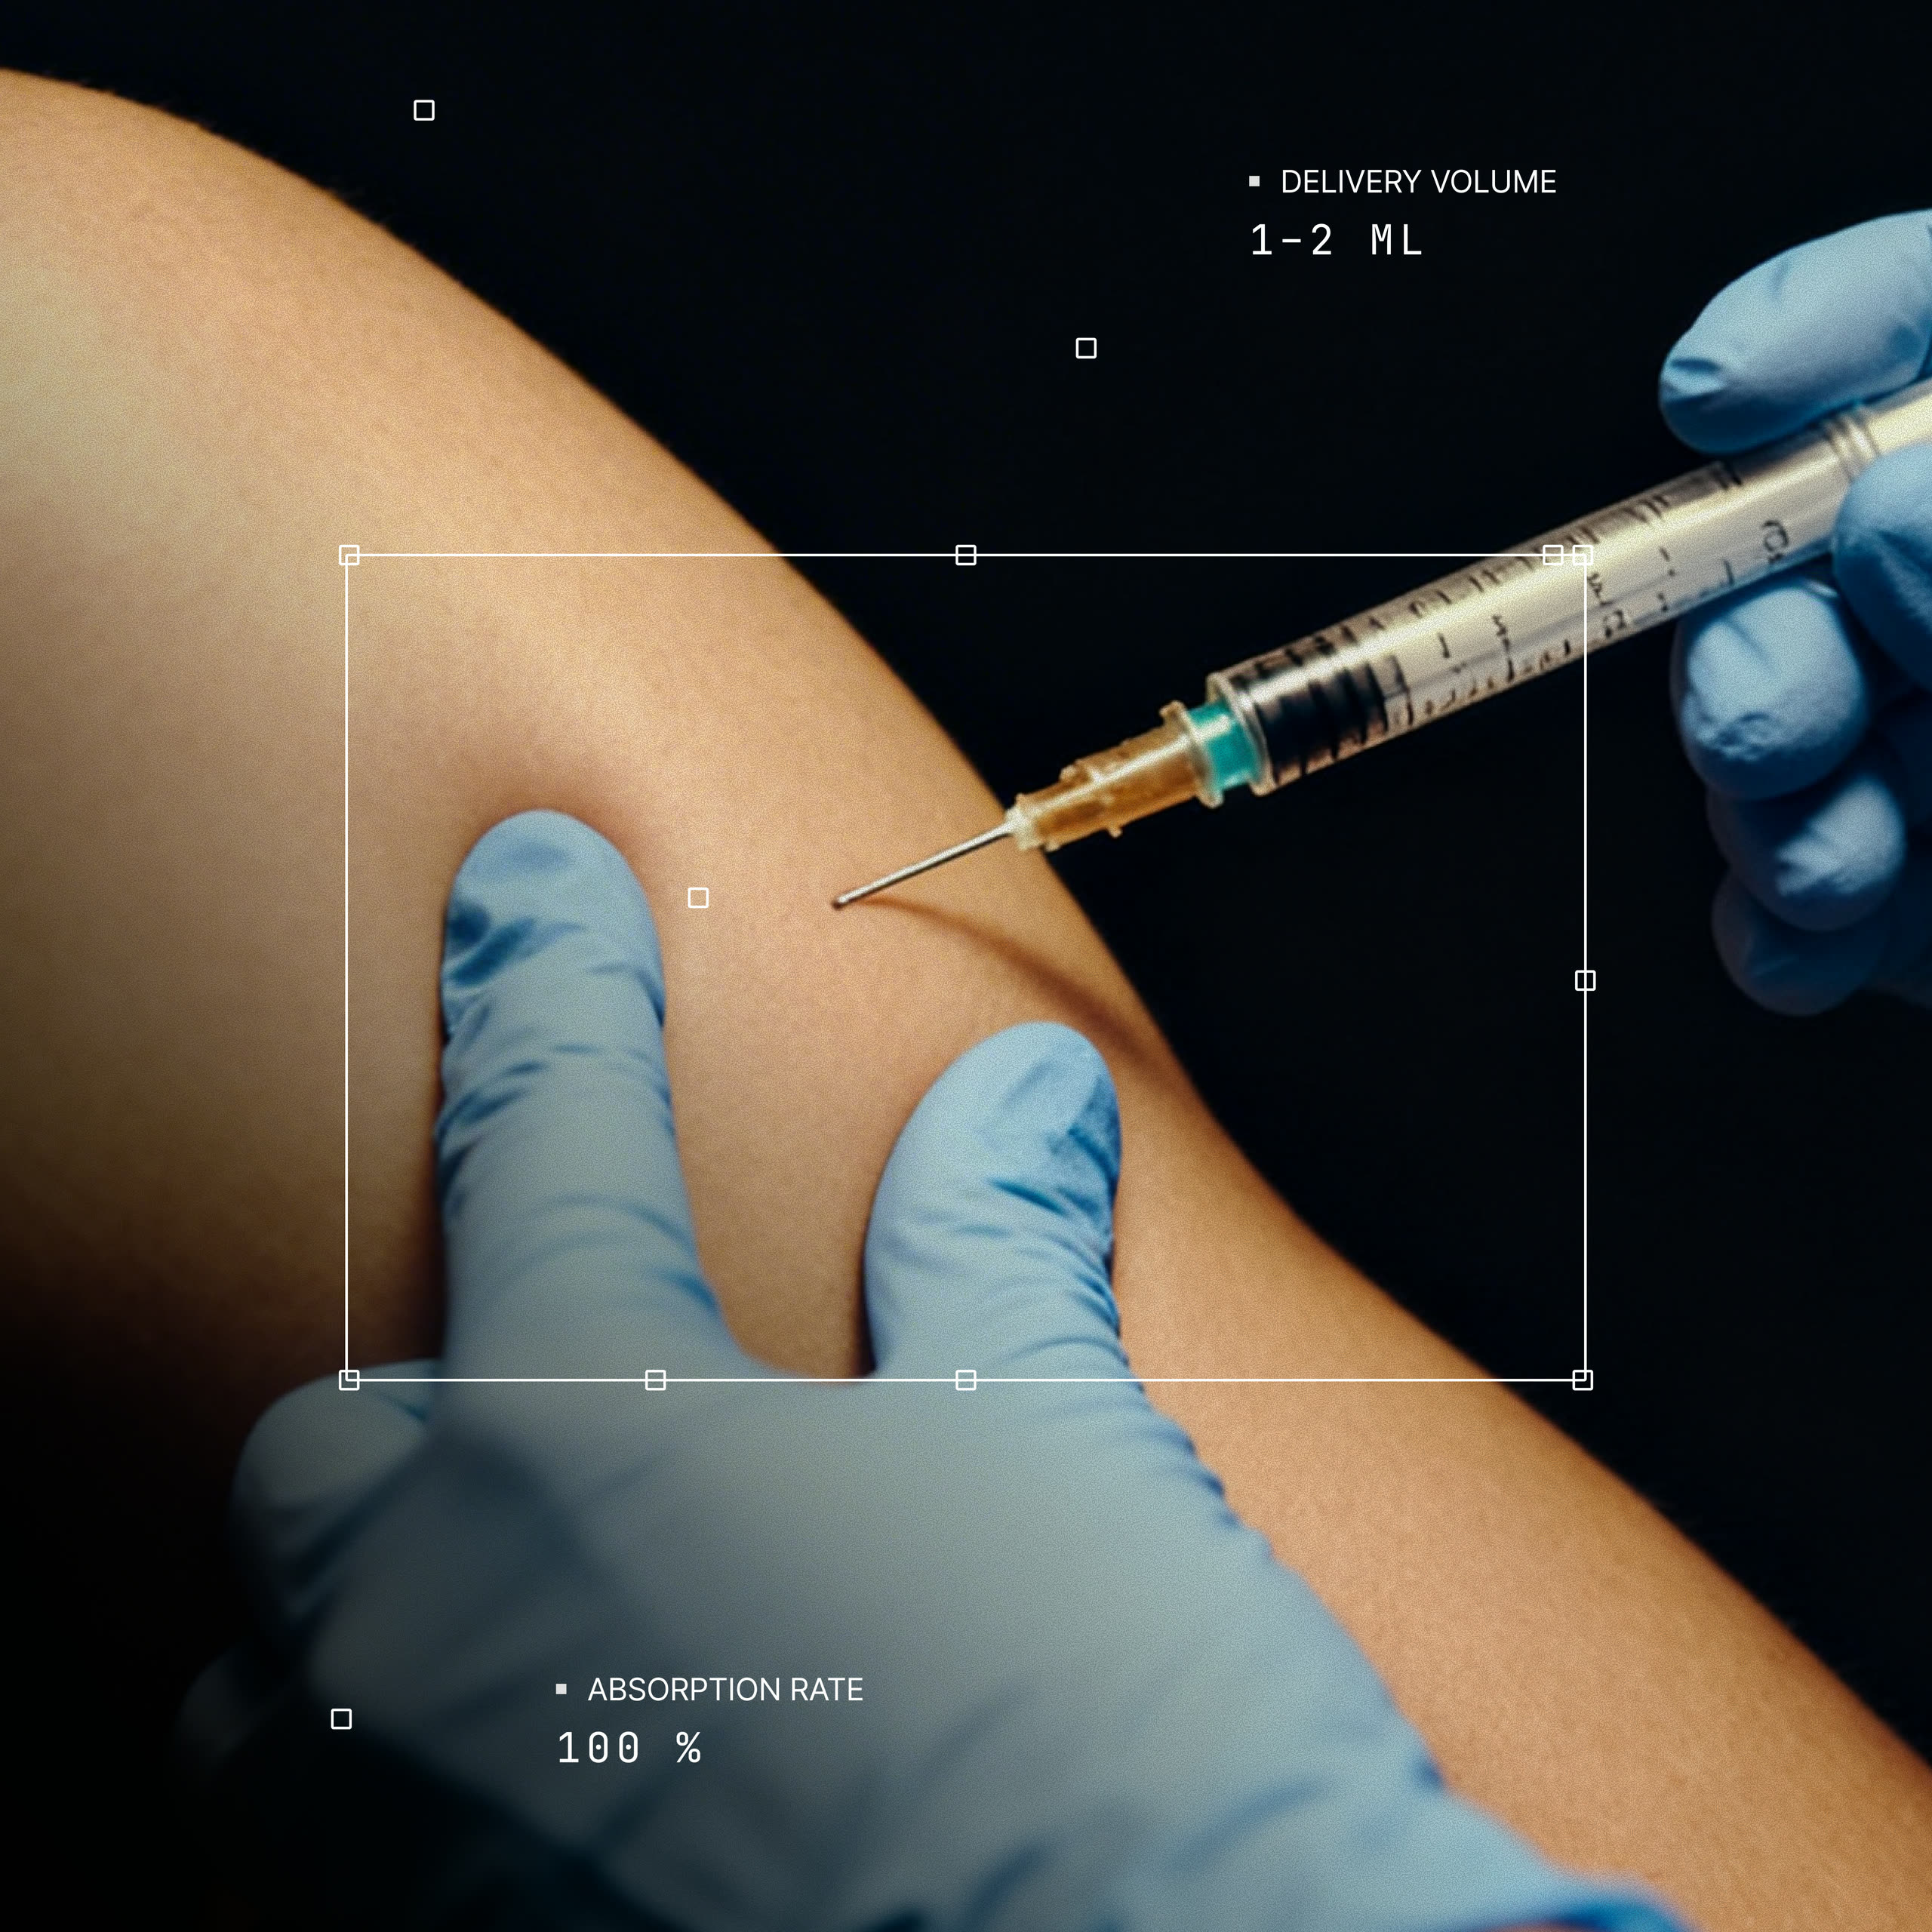
Diagnostics tell you where you are. The Action Plan is the part that says what to do about it, and advice is easy to give and hard to follow. So it is built as a week rather than a list: the totals sit at the top, the sessions sit on days, and each one says what it is and how long it takes. Exercise and nutrition are separate tabs because they are acted on at different times. It is also the part you take home, so it had to work as a PDF, which ruled out anything depending on tapping, hovering or a dark background. The layout needed to hold up in black and white, at whatever size it is printed, and still look like it came from the same place as the app.Dark mode from the start
Dark mode was designed alongside light rather than added afterwards. The whole dashboard is available in it, every station and every detail page, and it follows whichever the person prefers.